Estimated Value: $223,000 - $242,909
2
Beds
2
Baths
1,424
Sq Ft
$164/Sq Ft
Est. Value
About This Home
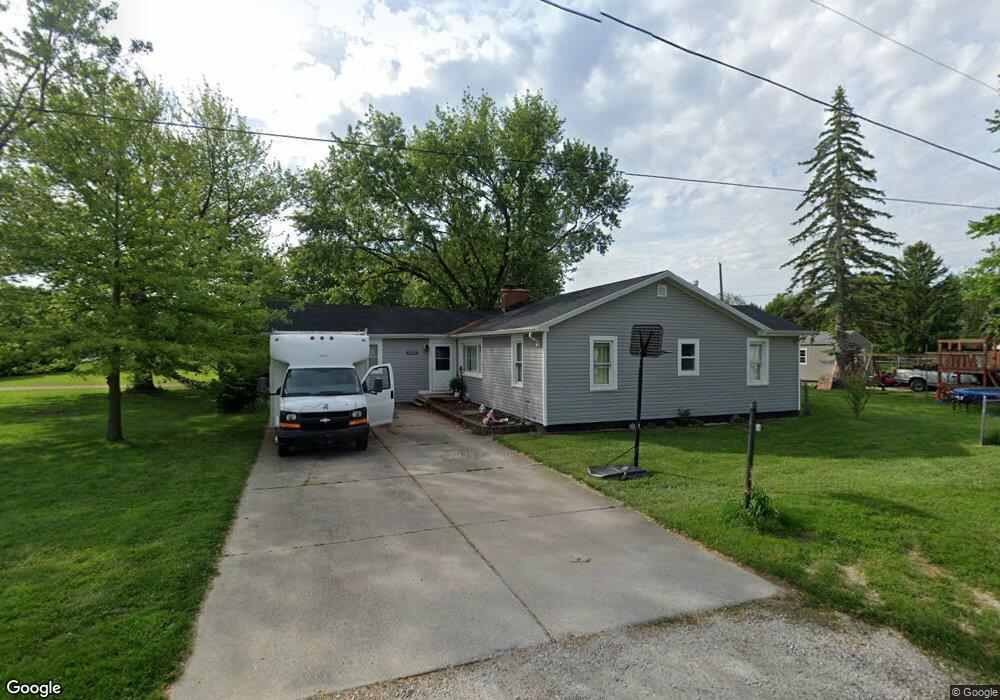
This home is located at 23280 State Route 51 W, Genoa, OH 43430 and is currently estimated at $233,227, approximately $163 per square foot. 23280 State Route 51 W is a home located in Ottawa County with nearby schools including Genoa Elementary School and Community Christian Academy.
Ownership History
Date
Name
Owned For
Owner Type
Purchase Details
Closed on
Nov 13, 2021
Sold by
Lemke Betty J
Bought by
Fork Andrew T and Sijic Jessica D
Current Estimated Value
Purchase Details
Closed on
Jun 3, 2009
Sold by
Hsbc Bank Usa National Association
Bought by
Lemke Betty J
Home Financials for this Owner
Home Financials are based on the most recent Mortgage that was taken out on this home.
Original Mortgage
$25,000
Interest Rate
4.83%
Mortgage Type
New Conventional
Purchase Details
Closed on
May 8, 2009
Sold by
Snider Thomas J and Snider Rebecca E
Bought by
Hsbc Bank Usa National Association
Home Financials for this Owner
Home Financials are based on the most recent Mortgage that was taken out on this home.
Original Mortgage
$25,000
Interest Rate
4.83%
Mortgage Type
New Conventional
Purchase Details
Closed on
Feb 8, 1993
Sold by
Smith Alice J
Bought by
Snider Thos J and Snider R3ebecca E S
Create a Home Valuation Report for This Property
The Home Valuation Report is an in-depth analysis detailing your home's value as well as a comparison with similar homes in the area
Home Values in the Area
Average Home Value in this Area
Purchase History
| Date | Buyer | Sale Price | Title Company |
|---|---|---|---|
| Fork Andrew T | -- | None Listed On Document | |
| Lemke Betty J | $45,100 | Platinum Title Services | |
| Hsbc Bank Usa National Association | $56,667 | None Available | |
| Snider Thos J | $68,500 | -- |
Source: Public Records
Mortgage History
| Date | Status | Borrower | Loan Amount |
|---|---|---|---|
| Previous Owner | Lemke Betty J | $25,000 |
Source: Public Records
Tax History Compared to Growth
Tax History
| Year | Tax Paid | Tax Assessment Tax Assessment Total Assessment is a certain percentage of the fair market value that is determined by local assessors to be the total taxable value of land and additions on the property. | Land | Improvement |
|---|---|---|---|---|
| 2024 | $4,083 | $66,682 | $13,545 | $53,137 |
| 2023 | $4,083 | $49,452 | $10,427 | $39,025 |
| 2022 | $3,006 | $49,452 | $10,427 | $39,025 |
| 2021 | $3,221 | $49,460 | $10,430 | $39,030 |
| 2020 | $2,488 | $42,220 | $6,860 | $35,360 |
| 2019 | $2,470 | $42,220 | $6,860 | $35,360 |
| 2018 | $2,456 | $42,220 | $6,860 | $35,360 |
| 2016 | $1,865 | $30,630 | $6,860 | $23,770 |
| 2015 | $1,874 | $30,630 | $6,860 | $23,770 |
| 2014 | $874 | $29,790 | $6,860 | $22,930 |
| 2013 | $1,753 | $29,790 | $6,860 | $22,930 |
Source: Public Records
Map
Nearby Homes
- 23225 Ohio 51
- 23430 State Route 51 W
- 22771 W Holt Harrigan Rd
- 1615 N Thyre Dr
- 1301 West St
- 1251 S Railroad St
- 416 Castle Cove
- 1350 N Genoa Clay Center Rd
- 207 E 11th St
- 904 Main St
- 510 Wilson St
- 514 West St
- 0 Circle Dr Unit 6133022
- 29118 Millbury Rd
- 29453 Harriet St
- 1642 Woodville Rd
- 29411 Mabel St
- 1861 N Opfer-Lentz Rd
- 24181 W James Ridge Rd
- 24764 Bradner Rd
- 23270 State Route 51 W
- 23310 State Route 51 W
- 23305 W Centerfield Dr
- 23250 W St Rt 51
- 23283 W Centerfield Dr
- 23327 W Centerfield Dr
- 23320 State Route 51 W
- 23261 W Centerfield Dr
- 23275 State Route 51 W
- 23240 State Route 51 W
- 23349 W Centerfield Dr
- 23239 W Centerfield Dr
- 23270 W Edgefield Dr
- 23270 W Edgefield Rd
- 23371 W Centerfield Dr
- 23230 State Route 51 W
- 23304 W Centerfield Dr
- 23282 W Centerfield Dr
- 23245 State Route 51 W
- 23350 State Route 51 W