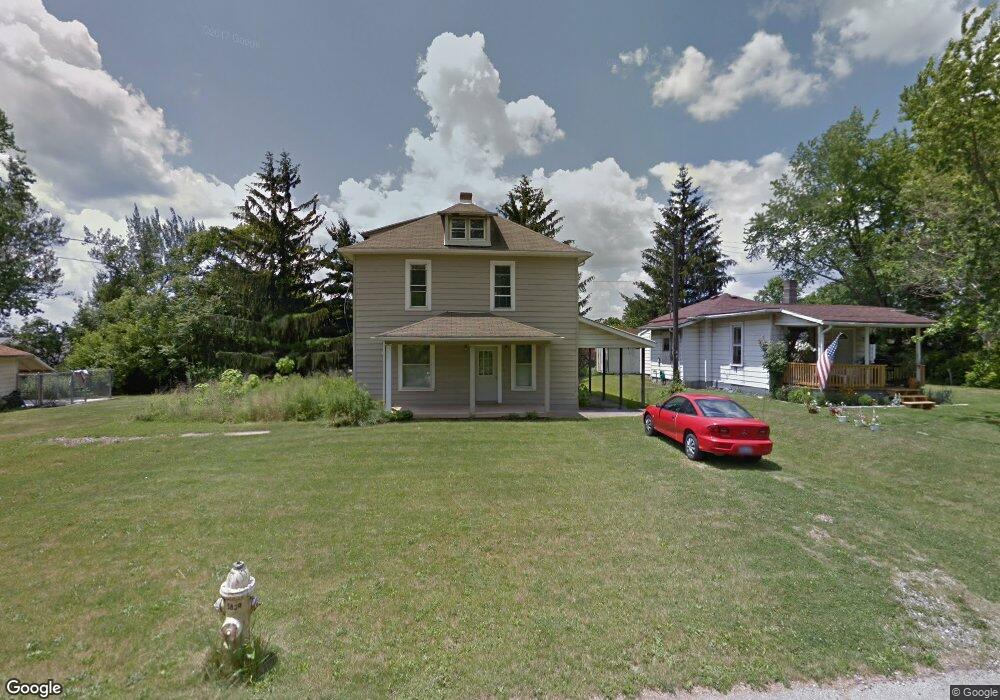
233 7th Ave Mansfield, OH 44905
Estimated Value: $96,000 - $146,000
3
Beds
1
Bath
1,568
Sq Ft
$72/Sq Ft
Est. Value
About This Home
This home is located at 233 7th Ave, Mansfield, OH 44905 and is currently estimated at $112,353, approximately $71 per square foot. 233 7th Ave is a home located in Richland County with nearby schools including Madison High School, St. Peter's Elementary/Montessori School, and Temple-Christian School.
Ownership History
Date
Name
Owned For
Owner Type
Purchase Details
Closed on
Aug 12, 2014
Sold by
Shafer Stephen and Shafer Elizabeth A
Bought by
Merwine Larry D
Current Estimated Value
Purchase Details
Closed on
Mar 1, 1996
Sold by
Pocock Beverly
Bought by
Hackworth David G and Hackworth Elizabeth
Home Financials for this Owner
Home Financials are based on the most recent Mortgage that was taken out on this home.
Original Mortgage
$42,750
Interest Rate
7.07%
Mortgage Type
New Conventional
Purchase Details
Closed on
Aug 1, 1986
Create a Home Valuation Report for This Property
The Home Valuation Report is an in-depth analysis detailing your home's value as well as a comparison with similar homes in the area
Home Values in the Area
Average Home Value in this Area
Purchase History
| Date | Buyer | Sale Price | Title Company |
|---|---|---|---|
| Merwine Larry D | $6,000 | Chicago Title Agency Of Nort | |
| Hackworth David G | $45,000 | -- | |
| -- | $10,000 | -- |
Source: Public Records
Mortgage History
| Date | Status | Borrower | Loan Amount |
|---|---|---|---|
| Previous Owner | Hackworth David G | $42,750 |
Source: Public Records
Tax History
| Year | Tax Paid | Tax Assessment Tax Assessment Total Assessment is a certain percentage of the fair market value that is determined by local assessors to be the total taxable value of land and additions on the property. | Land | Improvement |
|---|---|---|---|---|
| 2024 | $863 | $20,900 | $4,610 | $16,290 |
| 2023 | $863 | $20,900 | $4,610 | $16,290 |
| 2022 | $652 | $14,520 | $4,800 | $9,720 |
| 2021 | $652 | $14,520 | $4,800 | $9,720 |
| 2020 | $658 | $14,520 | $4,800 | $9,720 |
| 2019 | $576 | $11,470 | $3,230 | $8,240 |
| 2018 | $570 | $11,470 | $3,230 | $8,240 |
| 2017 | $454 | $11,470 | $3,230 | $8,240 |
| 2016 | $350 | $7,010 | $3,130 | $3,880 |
| 2015 | $343 | $7,010 | $3,130 | $3,880 |
| 2014 | $874 | $17,910 | $3,130 | $14,780 |
| 2012 | $846 | $18,470 | $3,230 | $15,240 |
Source: Public Records
Map
Nearby Homes
Your Personal Tour Guide
Ask me questions while you tour the home.