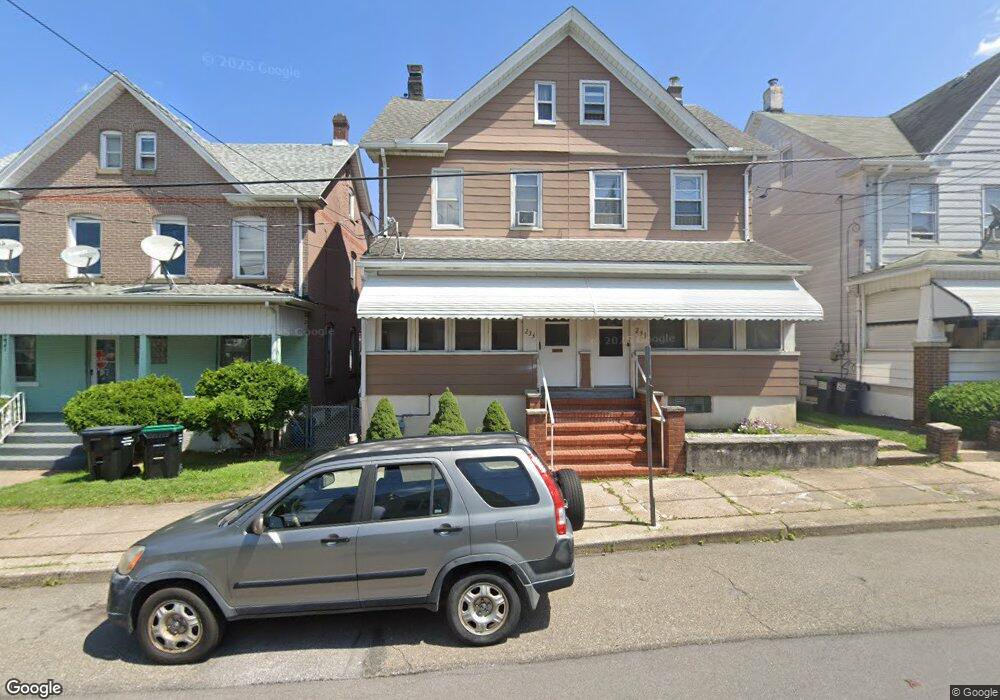
233 Allen St West Hazleton, PA 18202
Estimated Value: $140,459 - $184,000
--
Bed
--
Bath
1,894
Sq Ft
$85/Sq Ft
Est. Value
About This Home
This home is located at 233 Allen St, West Hazleton, PA 18202 and is currently estimated at $161,365, approximately $85 per square foot. 233 Allen St is a home located in Luzerne County with nearby schools including Hazleton Area High School, Immanuel Christian School, and Bishop Hafey Junior/Senior High School.
Ownership History
Date
Name
Owned For
Owner Type
Purchase Details
Closed on
Feb 20, 2015
Sold by
Puhak Glenwood J
Bought by
Franco Rosa and Gallo Jorge
Current Estimated Value
Home Financials for this Owner
Home Financials are based on the most recent Mortgage that was taken out on this home.
Original Mortgage
$12,000
Interest Rate
3.66%
Mortgage Type
Seller Take Back
Purchase Details
Closed on
Jul 19, 2001
Bought by
Puhak Glenwood J
Create a Home Valuation Report for This Property
The Home Valuation Report is an in-depth analysis detailing your home's value as well as a comparison with similar homes in the area
Home Values in the Area
Average Home Value in this Area
Purchase History
| Date | Buyer | Sale Price | Title Company |
|---|---|---|---|
| Franco Rosa | $47,000 | None Available | |
| Puhak Glenwood J | -- | -- |
Source: Public Records
Mortgage History
| Date | Status | Borrower | Loan Amount |
|---|---|---|---|
| Closed | Franco Rosa | $12,000 |
Source: Public Records
Tax History Compared to Growth
Tax History
| Year | Tax Paid | Tax Assessment Tax Assessment Total Assessment is a certain percentage of the fair market value that is determined by local assessors to be the total taxable value of land and additions on the property. | Land | Improvement |
|---|---|---|---|---|
| 2025 | $1,670 | $66,200 | $19,200 | $47,000 |
| 2024 | $1,615 | $66,200 | $19,200 | $47,000 |
| 2023 | $1,573 | $66,200 | $19,200 | $47,000 |
| 2022 | $1,561 | $66,200 | $19,200 | $47,000 |
| 2021 | $1,522 | $66,200 | $19,200 | $47,000 |
| 2020 | $1,501 | $66,200 | $19,200 | $47,000 |
| 2019 | $1,384 | $66,200 | $19,200 | $47,000 |
| 2018 | $1,341 | $66,200 | $19,200 | $47,000 |
| 2017 | $1,317 | $66,200 | $19,200 | $47,000 |
| 2016 | -- | $66,200 | $19,200 | $47,000 |
| 2015 | -- | $66,200 | $19,200 | $47,000 |
| 2014 | -- | $66,200 | $19,200 | $47,000 |
Source: Public Records
Map
Nearby Homes
- 124 Putnam St
- 312 Putnam St
- 0 Maple Ln Unit PALU2002574
- 145 W Monroe Ave
- 335 Putnam St
- 667 Roosevelt St
- 118 E Green St
- 590 Mckinley St
- 113 E Broad St
- 111 S Broad St
- 609 Landmesser Ave
- 9 Park St
- 7 W Diamond Ave
- 328 W Green St
- 31 Park St
- 903 Mckinley St
- 713 W 6th St
- 554 Peace St
- 782 N James St
- 585 Hanover Ct