Estimated Value: $542,000 - $616,002
4
Beds
4
Baths
3,294
Sq Ft
$180/Sq Ft
Est. Value
About This Home
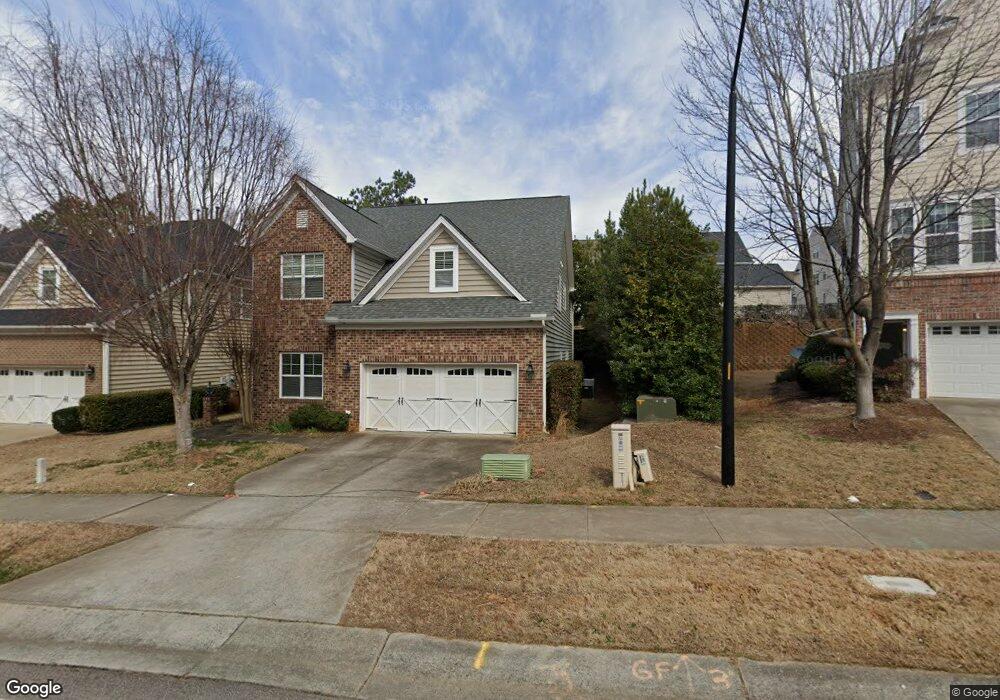
This home is located at 233 Bally Shannon Way, Apex, NC 27539 and is currently estimated at $591,501, approximately $179 per square foot. 233 Bally Shannon Way is a home located in Wake County with nearby schools including Middle Creek Elementary School, Dillard Drive Magnet Middle School, and Apex High School.
Ownership History
Date
Name
Owned For
Owner Type
Purchase Details
Closed on
Jul 12, 2019
Sold by
Opendoor Property Llc
Bought by
Silva John A and Silva Lorraine M
Current Estimated Value
Home Financials for this Owner
Home Financials are based on the most recent Mortgage that was taken out on this home.
Original Mortgage
$269,600
Outstanding Balance
$236,581
Interest Rate
3.9%
Mortgage Type
New Conventional
Estimated Equity
$354,920
Purchase Details
Closed on
Apr 26, 2019
Sold by
Antwi Abena Agyeiwaa
Bought by
Opendoor Property C Llc
Purchase Details
Closed on
Aug 29, 2009
Sold by
Hamilton Kimani N
Bought by
Antwi Abena Agyeiwaa
Purchase Details
Closed on
May 13, 2008
Sold by
Lennar Carolinas Llc
Bought by
Hamilton Kimani N and Antwi Abena Agyeiwaa
Home Financials for this Owner
Home Financials are based on the most recent Mortgage that was taken out on this home.
Original Mortgage
$224,750
Interest Rate
5.86%
Mortgage Type
Purchase Money Mortgage
Create a Home Valuation Report for This Property
The Home Valuation Report is an in-depth analysis detailing your home's value as well as a comparison with similar homes in the area
Home Values in the Area
Average Home Value in this Area
Purchase History
| Date | Buyer | Sale Price | Title Company |
|---|---|---|---|
| Silva John A | $337,000 | None Available | |
| Opendoor Property C Llc | $334,000 | None Available | |
| Antwi Abena Agyeiwaa | -- | None Available | |
| Hamilton Kimani N | $281,000 | None Available |
Source: Public Records
Mortgage History
| Date | Status | Borrower | Loan Amount |
|---|---|---|---|
| Open | Silva John A | $269,600 | |
| Previous Owner | Hamilton Kimani N | $224,750 |
Source: Public Records
Tax History Compared to Growth
Tax History
| Year | Tax Paid | Tax Assessment Tax Assessment Total Assessment is a certain percentage of the fair market value that is determined by local assessors to be the total taxable value of land and additions on the property. | Land | Improvement |
|---|---|---|---|---|
| 2025 | $5,061 | $585,754 | $110,000 | $475,754 |
| 2024 | $5,040 | $585,754 | $110,000 | $475,754 |
| 2023 | $4,125 | $380,605 | $60,000 | $320,605 |
| 2022 | $3,982 | $380,605 | $60,000 | $320,605 |
| 2021 | $3,908 | $380,605 | $60,000 | $320,605 |
| 2020 | $3,908 | $380,605 | $60,000 | $320,605 |
| 2019 | $3,635 | $300,416 | $55,000 | $245,416 |
| 2018 | $3,285 | $300,416 | $55,000 | $245,416 |
| 2017 | $3,167 | $300,416 | $55,000 | $245,416 |
| 2016 | $3,123 | $300,416 | $55,000 | $245,416 |
| 2015 | $3,292 | $311,768 | $65,000 | $246,768 |
| 2014 | $3,178 | $311,768 | $65,000 | $246,768 |
Source: Public Records
Map
Nearby Homes
- 104 Highland Mist Cir
- 208 Bellagio Dr
- 4724 Sunset Lake Rd
- 4721 Edwards Dr
- 9640 Holly Springs Rd
- 5033 Sunset Lake Rd
- 107 Ransomwood Dr
- 103 Pleasant Glen Ln
- 157 Writing Rock Place
- 155 Writing Rock Place
- 115 Bowerbank Ln
- 4425 Surry Ridge Cir
- 200 Seagraves Creek Ln
- 116 Seagraves Creek Ln
- 201 Mayfield Dr
- 209 Mayfield Dr
- 127 Willow View Ln
- 109 Willow View Ln
- 212 Mystic Pine Place
- 1023 Augustine Trail
- 229 Bally Shannon Way
- 237 Bally Shannon Way
- 239 Bally Shannon Way
- 225 Bally Shannon Way
- 241 Bally Shannon Way
- 133 Bally Shannon Way
- 137 Bally Shannon Way
- 129 Bally Shannon Way
- 141 Bally Shannon Way
- 243 Bally Shannon Way
- 221 Bally Shannon Way
- 252 Bally Shannon Way
- 125 Bally Shannon Way
- 201 Bally Shannon Way
- 254 Bally Shannon Way
- 245 Bally Shannon Way
- 217 Bally Shannon Way
- 256 Bally Shannon Way
- 205 Bally Shannon Way
- 121 Bally Shannon Way