Estimated Value: $167,000 - $203,703
4
Beds
2
Baths
1,710
Sq Ft
$108/Sq Ft
Est. Value
About This Home
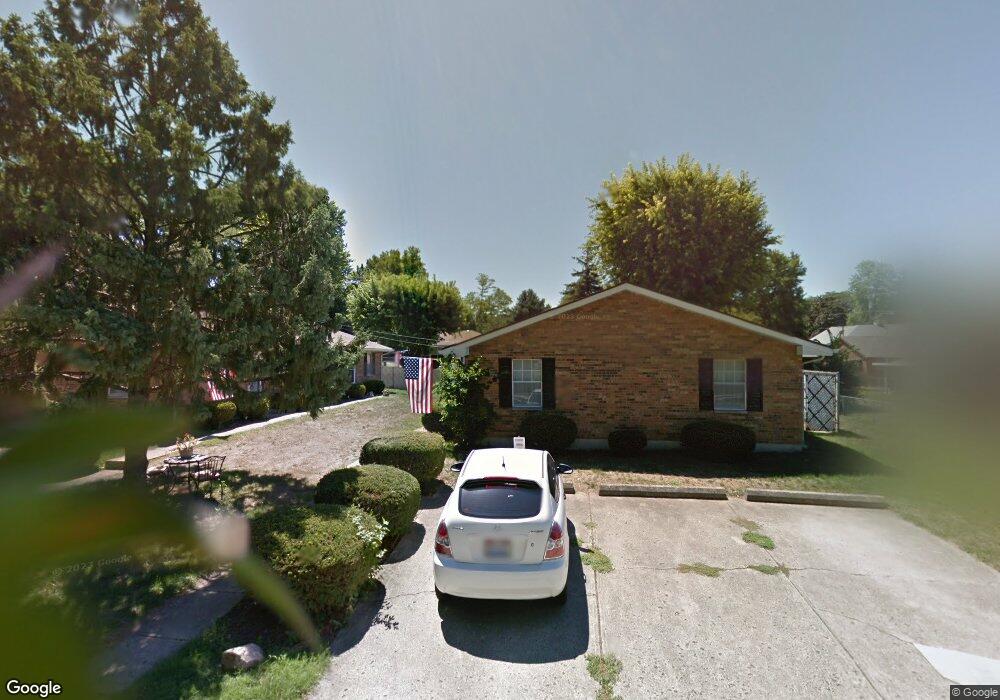
This home is located at 233 Branch St, Xenia, OH 45385 and is currently estimated at $184,426, approximately $107 per square foot. 233 Branch St is a home located in Greene County with nearby schools including Xenia High School, Summit Academy Community School for Alternative Learners - Xenia, and Legacy Christian Academy.
Ownership History
Date
Name
Owned For
Owner Type
Purchase Details
Closed on
Aug 21, 2019
Sold by
Brien Kevin R O and Brien Rebecca C O
Bought by
Gary L Wallman Llc
Current Estimated Value
Purchase Details
Closed on
May 10, 2006
Sold by
Neff Janet D
Bought by
Obrien Kevin R
Home Financials for this Owner
Home Financials are based on the most recent Mortgage that was taken out on this home.
Original Mortgage
$71,910
Interest Rate
6.39%
Mortgage Type
Commercial
Create a Home Valuation Report for This Property
The Home Valuation Report is an in-depth analysis detailing your home's value as well as a comparison with similar homes in the area
Home Values in the Area
Average Home Value in this Area
Purchase History
| Date | Buyer | Sale Price | Title Company |
|---|---|---|---|
| Gary L Wallman Llc | $105,000 | None Available | |
| Obrien Kevin R | $84,600 | None Available |
Source: Public Records
Mortgage History
| Date | Status | Borrower | Loan Amount |
|---|---|---|---|
| Previous Owner | Obrien Kevin R | $71,910 |
Source: Public Records
Tax History Compared to Growth
Tax History
| Year | Tax Paid | Tax Assessment Tax Assessment Total Assessment is a certain percentage of the fair market value that is determined by local assessors to be the total taxable value of land and additions on the property. | Land | Improvement |
|---|---|---|---|---|
| 2024 | $2,112 | $49,370 | $4,020 | $45,350 |
| 2023 | $2,112 | $49,370 | $4,020 | $45,350 |
| 2022 | $1,815 | $36,170 | $2,510 | $33,660 |
| 2021 | $1,839 | $36,170 | $2,510 | $33,660 |
| 2020 | $1,762 | $36,170 | $2,510 | $33,660 |
| 2019 | $1,522 | $29,420 | $2,810 | $26,610 |
| 2018 | $1,528 | $29,420 | $2,810 | $26,610 |
| 2017 | $1,484 | $29,420 | $2,810 | $26,610 |
| 2016 | $1,493 | $28,200 | $2,810 | $25,390 |
| 2015 | $1,497 | $28,200 | $2,810 | $25,390 |
| 2014 | $1,433 | $28,200 | $2,810 | $25,390 |
Source: Public Records
Map
Nearby Homes