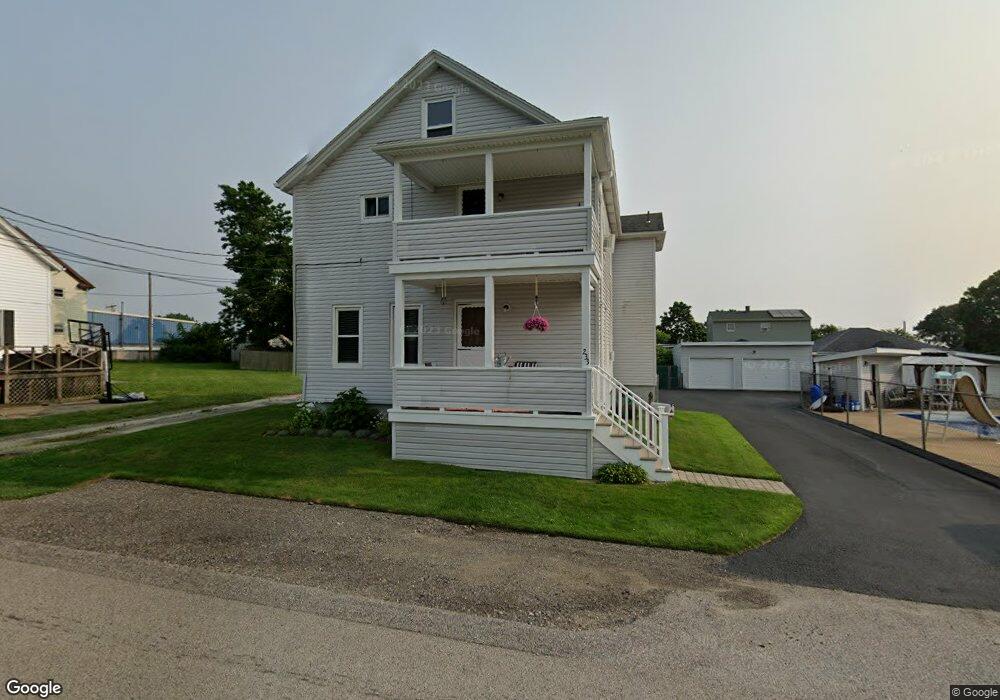
233 Chace Ave Tiverton, RI 02878
North Tiverton NeighborhoodEstimated Value: $432,000 - $489,000
4
Beds
2
Baths
2,106
Sq Ft
$222/Sq Ft
Est. Value
About This Home
This home is located at 233 Chace Ave, Tiverton, RI 02878 and is currently estimated at $468,148, approximately $222 per square foot. 233 Chace Ave is a home located in Newport County with nearby schools including Tiverton High School, Argosy Collegiate Charter School, and Saint Stanislaus School.
Ownership History
Date
Name
Owned For
Owner Type
Purchase Details
Closed on
May 16, 2024
Sold by
Pacheco Jose M
Bought by
Jose M Pacheco Irt and Pacheco
Current Estimated Value
Purchase Details
Closed on
Aug 15, 2001
Sold by
Derocco Priscilla A and Derocco Howard
Bought by
Pacheco Jose M
Create a Home Valuation Report for This Property
The Home Valuation Report is an in-depth analysis detailing your home's value as well as a comparison with similar homes in the area
Home Values in the Area
Average Home Value in this Area
Purchase History
| Date | Buyer | Sale Price | Title Company |
|---|---|---|---|
| Jose M Pacheco Irt | -- | None Available | |
| Jose M Pacheco Irt | -- | None Available | |
| Pacheco Jose M | $160,000 | -- | |
| Pacheco Jose M | $160,000 | -- |
Source: Public Records
Mortgage History
| Date | Status | Borrower | Loan Amount |
|---|---|---|---|
| Previous Owner | Pacheco Jose M | $77,000 | |
| Previous Owner | Pacheco Jose M | $120,000 | |
| Previous Owner | Pacheco Jose M | $98,000 | |
| Previous Owner | Pacheco Jose M | $123,000 |
Source: Public Records
Tax History Compared to Growth
Tax History
| Year | Tax Paid | Tax Assessment Tax Assessment Total Assessment is a certain percentage of the fair market value that is determined by local assessors to be the total taxable value of land and additions on the property. | Land | Improvement |
|---|---|---|---|---|
| 2025 | $4,049 | $366,400 | $99,600 | $266,800 |
| 2024 | $4,049 | $366,400 | $99,600 | $266,800 |
| 2023 | $3,737 | $250,800 | $87,200 | $163,600 |
| 2022 | $3,669 | $250,800 | $87,200 | $163,600 |
| 2021 | $3,767 | $264,000 | $87,200 | $176,800 |
| 2020 | $3,737 | $230,800 | $62,700 | $168,100 |
| 2019 | $3,644 | $230,800 | $62,700 | $168,100 |
| 2018 | $3,783 | $230,800 | $62,700 | $168,100 |
| 2017 | $3,711 | $194,800 | $62,700 | $132,100 |
| 2016 | $3,728 | $194,800 | $62,700 | $132,100 |
| 2015 | $3,728 | $194,800 | $62,700 | $132,100 |
| 2014 | $3,576 | $185,300 | $62,700 | $122,600 |
Source: Public Records
Map
Nearby Homes
- 391 Clarkson St
- 0 Sampson St
- 579 Summit St Unit 3
- 579 Summit St Unit 2
- 238 Judson St
- 39 Hilton St
- 584-586 Mount Hope Ave
- 66 Bailey St
- 105 Borden Rd
- 0 Kaufman Rd Unit 73333701
- 0 Kaufman Rd Unit 1384670
- 126 Wheeler St
- 78 Kaufman Rd
- 495 Hooper St
- 616 Woodman St
- 345 Main Rd Unit 204
- 133 Kempton St
- 109 Kaufman Rd
- 12 Horizon Dr
- 17 Lynwood St