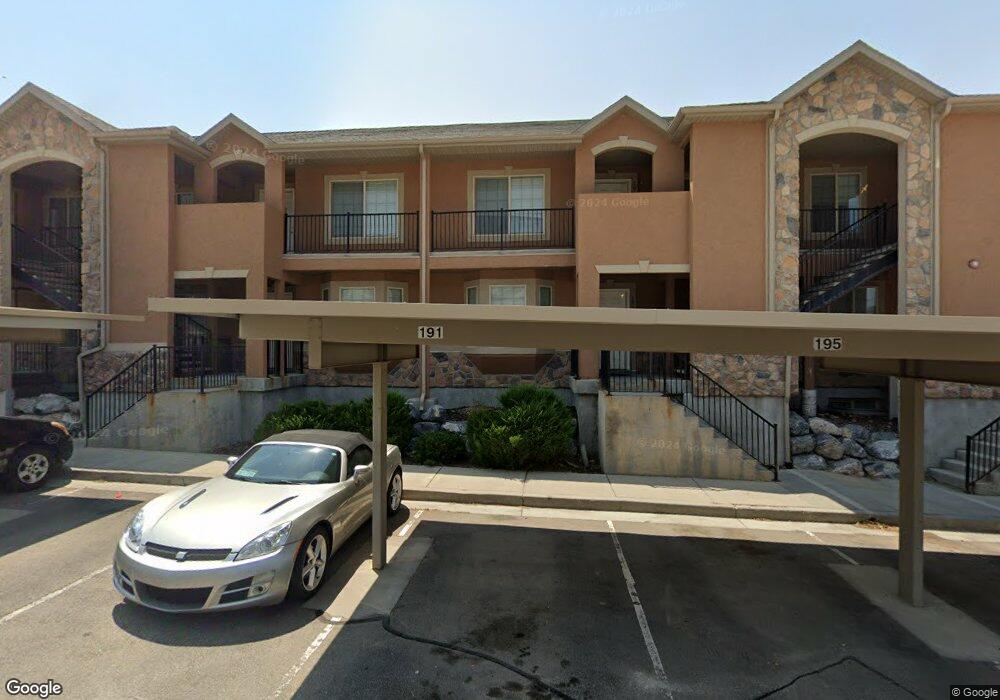
233 Crescent View Ln Unit 193 Tooele, UT 84074
Estimated Value: $313,000 - $347,000
3
Beds
3
Baths
2,042
Sq Ft
$161/Sq Ft
Est. Value
About This Home
This home is located at 233 Crescent View Ln Unit 193, Tooele, UT 84074 and is currently estimated at $328,023, approximately $160 per square foot. 233 Crescent View Ln Unit 193 is a home located in Tooele County with nearby schools including Copper Canyon Elementary School, Clarke N. Johnsen Junior High School, and Stansbury High School.
Ownership History
Date
Name
Owned For
Owner Type
Purchase Details
Closed on
Sep 22, 2023
Sold by
Fairbourn Judith A
Bought by
Thorne David K and Thorne Sidney B
Current Estimated Value
Purchase Details
Closed on
Mar 26, 2019
Sold by
Lee Family Trust
Bought by
Fairbourn Judith A
Purchase Details
Closed on
Nov 1, 2010
Sold by
Strum Gary
Bought by
Sonyador Llc
Purchase Details
Closed on
Nov 25, 2009
Sold by
Ornig Co Llc
Bought by
Lee Nancy
Home Financials for this Owner
Home Financials are based on the most recent Mortgage that was taken out on this home.
Original Mortgage
$97,900
Interest Rate
5.01%
Mortgage Type
New Conventional
Purchase Details
Closed on
May 27, 2009
Sold by
The Maples Of Tooele Llc
Bought by
Sturm Gary and Sturm Kimberly
Create a Home Valuation Report for This Property
The Home Valuation Report is an in-depth analysis detailing your home's value as well as a comparison with similar homes in the area
Home Values in the Area
Average Home Value in this Area
Purchase History
| Date | Buyer | Sale Price | Title Company |
|---|---|---|---|
| Thorne David K | -- | Inwest Title | |
| Fairbourn Judith A | -- | First American Title Ins Co | |
| Sonyador Llc | -- | Charger Title | |
| Lee Nancy | -- | Inwest Title Ser Inc | |
| Sturm Gary | $1,160,000 | Charger Title |
Source: Public Records
Mortgage History
| Date | Status | Borrower | Loan Amount |
|---|---|---|---|
| Previous Owner | Lee Nancy | $97,900 |
Source: Public Records
Tax History Compared to Growth
Tax History
| Year | Tax Paid | Tax Assessment Tax Assessment Total Assessment is a certain percentage of the fair market value that is determined by local assessors to be the total taxable value of land and additions on the property. | Land | Improvement |
|---|---|---|---|---|
| 2025 | $2,251 | $341,327 | $30,003 | $311,324 |
| 2024 | $2,512 | $191,723 | $55,000 | $136,723 |
| 2023 | $2,512 | $154,928 | $36,300 | $118,628 |
| 2022 | $1,697 | $146,002 | $41,250 | $104,752 |
| 2021 | $1,508 | $108,498 | $9,506 | $98,992 |
| 2020 | $1,437 | $179,433 | $17,284 | $162,149 |
| 2019 | $1,461 | $179,433 | $17,284 | $162,149 |
| 2018 | $1,286 | $149,719 | $20,000 | $129,719 |
| 2017 | $998 | $137,926 | $20,000 | $117,926 |
| 2016 | $885 | $72,771 | $11,000 | $61,771 |
| 2015 | $885 | $64,362 | $0 | $0 |
| 2014 | -- | $64,362 | $0 | $0 |
Source: Public Records
Map
Nearby Homes
- 234 W Crescent Ln Unit 99
- 244 W Crescent Ln N Unit 94
- 244 W Crescent Ln N Unit 95
- 244 W Crescent Ln N Unit 96
- 23 W 1160 N Unit 14
- 231 W 1160 N Unit 15
- 241 W 1160 N Unit 17
- 241 W 1160 N Unit 19
- 241 W 1160 N Unit 18
- 251 W 1160 N Unit 23
- 251 W 1160 N Unit 22
- Cottonwood Plan at Prosperity at Overlake
- Willow Plan at Prosperity at Overlake
- Pine Plan at Prosperity at Overlake
- Aspen Plan at Prosperity at Overlake
- 1368 N Baen Way
- 1368 Baen Way Unit 236
- 124 Ebbets Field
- 1416 Baen Way Unit 240
- 1428 Baen Way Unit 241
- 233 Crescent View Ln
- 233 Crescent View Ln
- 233 Crescent View Ln
- 233 Crescent View Ln
- 233 Crescent View Ln
- 233 Crescent View Ln
- 233 Crescent View Ln
- 233 Crescent View Ln Unit 191
- 233 Crescent View Ln
- 233 W Crescent Ln Unit 196
- 233 Crescent View Ln Unit 194
- 233 Crescent View Ln Unit 197
- 233 Crescent View Ln Unit 196
- 233 Crescent View Ln Unit 195
- 233 Crescent View Ln Unit 190
- 233 Crescent View Ln Unit 198
- 233 Crescent View Ln Unit 199
- 233 Crescent View Ln Unit 192
- 224 Crescent View Ln Unit 105
- 224 Crescent View Ln Unit 104