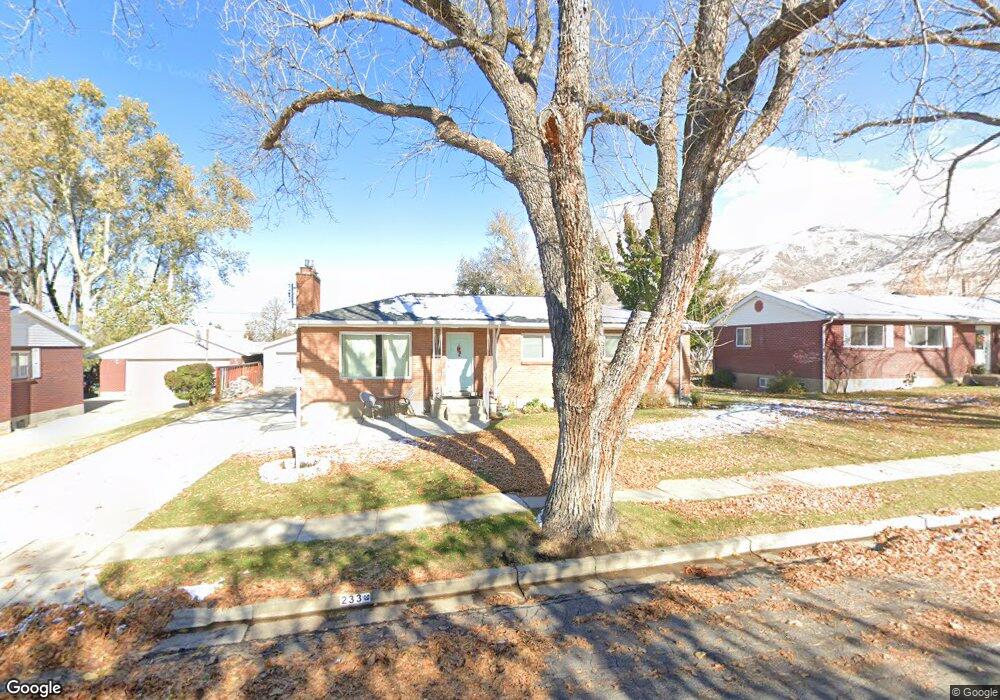
233 E 1250 N Bountiful, UT 84010
Estimated Value: $475,000 - $516,000
6
Beds
2
Baths
2,208
Sq Ft
$227/Sq Ft
Est. Value
About This Home
This home is located at 233 E 1250 N, Bountiful, UT 84010 and is currently estimated at $500,898, approximately $226 per square foot. 233 E 1250 N is a home located in Davis County with nearby schools including Tolman School, Centerville Jr High, and Viewmont High School.
Ownership History
Date
Name
Owned For
Owner Type
Purchase Details
Closed on
Feb 13, 2020
Sold by
Baldwin Branden G and Baldwin Chantell
Bought by
Palmares Jordan Bell and Torres Gustavo Palomares
Current Estimated Value
Home Financials for this Owner
Home Financials are based on the most recent Mortgage that was taken out on this home.
Original Mortgage
$351,037
Outstanding Balance
$308,760
Interest Rate
3.37%
Mortgage Type
FHA
Estimated Equity
$192,138
Purchase Details
Closed on
Apr 29, 2013
Sold by
Redd Kaylene B and Blankinship Suzanne B
Bought by
Baldwin Branden G and Baldwin Chantell
Home Financials for this Owner
Home Financials are based on the most recent Mortgage that was taken out on this home.
Original Mortgage
$180,405
Interest Rate
3.6%
Mortgage Type
New Conventional
Purchase Details
Closed on
Dec 31, 1997
Sold by
Bunting Shirl H and Bunting Mona Jean R
Bought by
Bunting Shirl H and Bunting Mona J
Create a Home Valuation Report for This Property
The Home Valuation Report is an in-depth analysis detailing your home's value as well as a comparison with similar homes in the area
Purchase History
| Date | Buyer | Sale Price | Title Company |
|---|---|---|---|
| Palmares Jordan Bell | -- | Investors Title Ins | |
| Baldwin Branden G | -- | Us Title Company Of | |
| Bunting Shirl H | -- | -- |
Source: Public Records
Mortgage History
| Date | Status | Borrower | Loan Amount |
|---|---|---|---|
| Open | Palmares Jordan Bell | $351,037 | |
| Previous Owner | Baldwin Branden G | $180,405 |
Source: Public Records
Tax History
| Year | Tax Paid | Tax Assessment Tax Assessment Total Assessment is a certain percentage of the fair market value that is determined by local assessors to be the total taxable value of land and additions on the property. | Land | Improvement |
|---|---|---|---|---|
| 2025 | $2,817 | $256,850 | $123,558 | $133,292 |
| 2024 | $2,653 | $251,350 | $107,919 | $143,431 |
| 2023 | $2,517 | $432,000 | $200,887 | $231,113 |
| 2022 | $2,686 | $253,550 | $110,330 | $143,220 |
| 2021 | $2,531 | $366,000 | $144,291 | $221,709 |
| 2020 | $2,240 | $325,000 | $124,015 | $200,985 |
| 2019 | $2,038 | $287,000 | $136,245 | $150,755 |
| 2018 | $1,886 | $261,000 | $133,676 | $127,324 |
| 2016 | $1,597 | $119,460 | $53,886 | $65,574 |
| 2015 | $1,586 | $112,145 | $53,886 | $58,259 |
| 2014 | $1,633 | $119,208 | $53,886 | $65,322 |
| 2013 | -- | $107,875 | $41,880 | $65,995 |
Source: Public Records
Map
Nearby Homes
- 1420 N Main St
- 967 S Courtyard Ln
- 96 Village Square Rd
- 1260 N 200 W
- 610 E Pages Ln
- 951 Centerville Commons Way
- 1130 N 200 W
- 662 E 1200 N
- 106 W 700 N
- 184 Park Shadows Cir
- 453 N 400 E Unit 7-D
- 16 W 780 S
- 235 W 1400 N
- 345 E 600 S
- 345 N 400 E
- 563 N 200 W
- 49 E 200 N Unit 4
- 41 E 200 N Unit 6
- 499 N 200 W Unit 30
- 252 N Main St
Your Personal Tour Guide
Ask me questions while you tour the home.