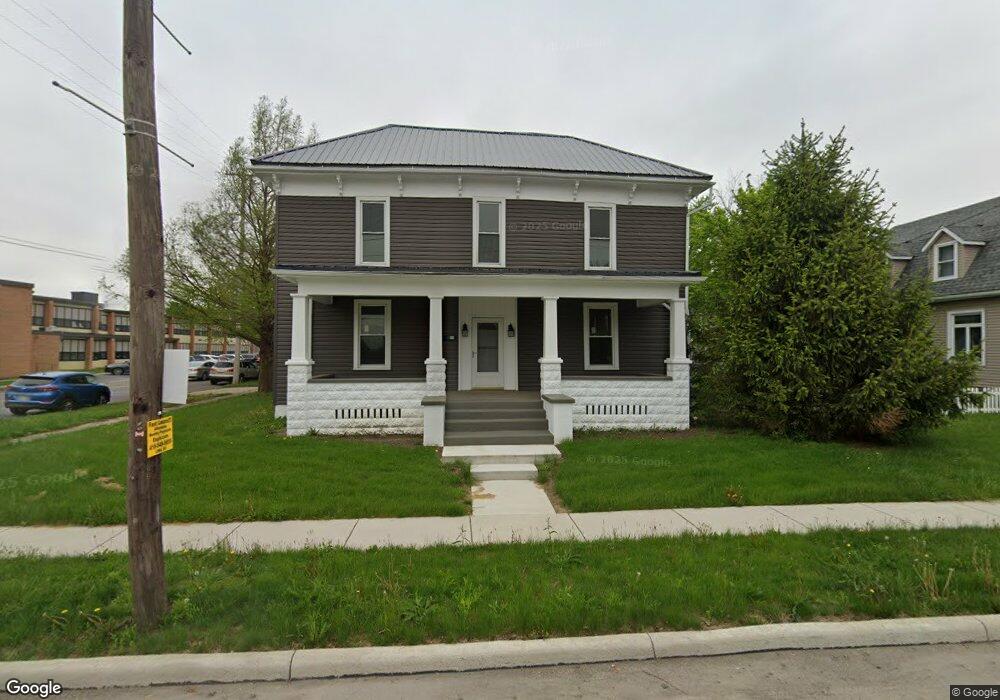
233 E 5th St Delphos, OH 45833
Estimated Value: $134,000 - $203,000
4
Beds
2
Baths
2,374
Sq Ft
$75/Sq Ft
Est. Value
About This Home
This home is located at 233 E 5th St, Delphos, OH 45833 and is currently estimated at $179,075, approximately $75 per square foot. 233 E 5th St is a home located in Allen County with nearby schools including Delphos St. John's High School and Delphos St. John's Elementary School.
Ownership History
Date
Name
Owned For
Owner Type
Purchase Details
Closed on
Oct 4, 2024
Sold by
Sheeter Steve R and Sheeter John Jeffrey
Bought by
County Line Auto Wrecking & Sales Llc
Current Estimated Value
Purchase Details
Closed on
Dec 11, 2007
Sold by
The Bank Of New York Trust Co Na
Bought by
Sheeter John Jeffrey and Sheeter Stephen R
Home Financials for this Owner
Home Financials are based on the most recent Mortgage that was taken out on this home.
Original Mortgage
$37,471
Interest Rate
6.75%
Purchase Details
Closed on
Nov 1, 2002
Sold by
Stevenson Milton T
Bought by
Thompson Trevor A and Thompson Angela D
Home Financials for this Owner
Home Financials are based on the most recent Mortgage that was taken out on this home.
Original Mortgage
$68,000
Interest Rate
8.62%
Mortgage Type
New Conventional
Purchase Details
Closed on
Dec 16, 1986
Bought by
Stevenson Milton T
Create a Home Valuation Report for This Property
The Home Valuation Report is an in-depth analysis detailing your home's value as well as a comparison with similar homes in the area
Home Values in the Area
Average Home Value in this Area
Purchase History
| Date | Buyer | Sale Price | Title Company |
|---|---|---|---|
| County Line Auto Wrecking & Sales Llc | $65,400 | None Listed On Document | |
| Sheeter John Jeffrey | $36,300 | Landcastle Titkle | |
| Thompson Trevor A | $80,000 | -- | |
| Stevenson Milton T | $29,900 | -- |
Source: Public Records
Mortgage History
| Date | Status | Borrower | Loan Amount |
|---|---|---|---|
| Previous Owner | Sheeter John Jeffrey | $37,471 | |
| Previous Owner | Thompson Trevor A | $68,000 |
Source: Public Records
Tax History
| Year | Tax Paid | Tax Assessment Tax Assessment Total Assessment is a certain percentage of the fair market value that is determined by local assessors to be the total taxable value of land and additions on the property. | Land | Improvement |
|---|---|---|---|---|
| 2024 | $1,585 | $49,990 | $7,180 | $42,810 |
| 2023 | $1,249 | $37,320 | $5,360 | $31,960 |
| 2022 | $1,280 | $37,320 | $5,360 | $31,960 |
| 2021 | $1,287 | $37,320 | $5,360 | $31,960 |
| 2020 | $1,086 | $33,040 | $5,110 | $27,930 |
| 2019 | $1,086 | $33,040 | $5,110 | $27,930 |
| 2018 | $1,067 | $33,040 | $5,110 | $27,930 |
| 2017 | $1,019 | $30,490 | $5,110 | $25,380 |
| 2016 | $1,033 | $30,490 | $5,110 | $25,380 |
| 2015 | $1,020 | $30,490 | $5,110 | $25,380 |
| 2014 | $998 | $29,370 | $4,900 | $24,470 |
| 2013 | $1,004 | $29,370 | $4,900 | $24,470 |
Source: Public Records
Map
Nearby Homes
- 405 N Franklin St
- 201 E 5th St
- 610 N Washington St
- 704 N Franklin St
- 702 N Main St
- 629 N Main St
- 821 E 3rd St
- 221 S Main St
- 409 N Bredeick St
- 709 W 4th St
- 424 S Canal St
- 537 / 539 Toomey
- 708 W 1st St
- 483 S Franklin St
- 420 S Cass St
- 310 E Suthoff St
- 10429 Ohio 66
- 827 S Washington St
- 1000 Colettas Way
- 241 King St
Your Personal Tour Guide
Ask me questions while you tour the home.