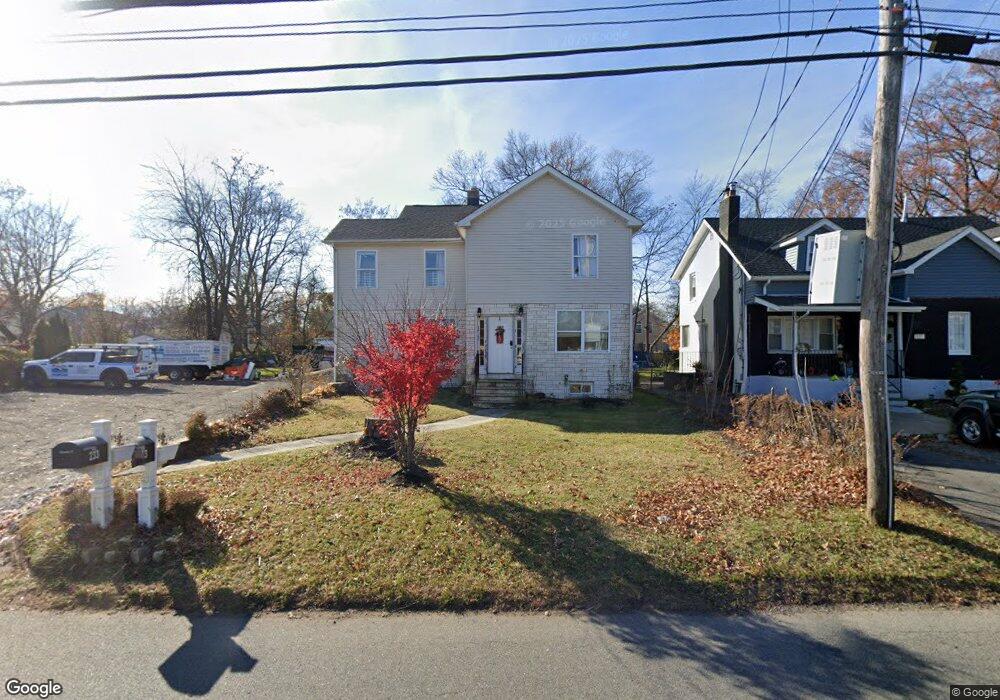
233 E Hanover Ave Morristown, NJ 07960
Estimated Value: $589,000 - $739,462
4
Beds
4
Baths
1,920
Sq Ft
$337/Sq Ft
Est. Value
About This Home
This home is located at 233 E Hanover Ave, Morristown, NJ 07960 and is currently estimated at $646,366, approximately $336 per square foot. 233 E Hanover Ave is a home located in Morris County with nearby schools including Hillcrest School, Thomas Jefferson School, and Alfred Vail School.
Ownership History
Date
Name
Owned For
Owner Type
Purchase Details
Closed on
Sep 12, 2016
Sold by
Hohn Sion D
Bought by
Steinmeyer Matthew and Montalbano Joseph
Current Estimated Value
Home Financials for this Owner
Home Financials are based on the most recent Mortgage that was taken out on this home.
Original Mortgage
$312,000
Interest Rate
3.48%
Mortgage Type
New Conventional
Purchase Details
Closed on
Jun 15, 2015
Sold by
Hohn Claudette
Bought by
Hohn Sion and Hohn Cythia
Home Financials for this Owner
Home Financials are based on the most recent Mortgage that was taken out on this home.
Original Mortgage
$242,400
Interest Rate
3.84%
Mortgage Type
New Conventional
Purchase Details
Closed on
Jan 14, 2009
Sold by
Langley Carlton
Bought by
Hohn Claudette
Purchase Details
Closed on
Aug 10, 2007
Sold by
Hohn Claudette
Bought by
Langley Carlton
Create a Home Valuation Report for This Property
The Home Valuation Report is an in-depth analysis detailing your home's value as well as a comparison with similar homes in the area
Home Values in the Area
Average Home Value in this Area
Purchase History
| Date | Buyer | Sale Price | Title Company |
|---|---|---|---|
| Steinmeyer Matthew | $390,000 | Main Street Title & Settleme | |
| Hohn Sion | $303,000 | Downtown Abstract Inc | |
| Hohn Claudette | -- | None Available | |
| Langley Carlton | -- | None Available |
Source: Public Records
Mortgage History
| Date | Status | Borrower | Loan Amount |
|---|---|---|---|
| Previous Owner | Steinmeyer Matthew | $312,000 | |
| Previous Owner | Hohn Sion | $242,400 |
Source: Public Records
Tax History
| Year | Tax Paid | Tax Assessment Tax Assessment Total Assessment is a certain percentage of the fair market value that is determined by local assessors to be the total taxable value of land and additions on the property. | Land | Improvement |
|---|---|---|---|---|
| 2025 | $5,632 | $281,300 | $85,100 | $196,200 |
| 2024 | $5,640 | $281,300 | $85,100 | $196,200 |
Source: Public Records
Map
Nearby Homes
- 12 Stone Ct
- 54 Hillairy Ave
- 231 Vista Dr
- 17 Frederick Place
- 1 Willard Place
- 1 Pocahontas St
- 186 Mills St
- 18 Harding Terrace
- 1 Parker Ave
- 2 Harding Terrace
- 8 Grant St
- 50 Morris Ave
- 17A Cleveland St
- 11 King St
- 33 Clinton Place
- 7 Prospect St Unit 303
- 7 Prospect St Unit 410
- 10 Cedar Run
- 49 Atno Ave
- 41 Atno Ave
- 231 E Hanover Ave
- 229 E Hanover Ave
- 237 E Hanover Ave
- 227 E Hanover Ave
- 239 E Hanover Ave
- 32 Highland Ave
- 30 Highland Ave
- 36 Highland Ave
- 225 E Hanover Ave
- 28 Highland Ave
- 241 E Hanover Ave
- 38 Highland Ave
- 26 Highland Ave
- 223 E Hanover Ave
- 24 Highland Ave
- 243 E Hanover Ave
- 40 Highland Ave
- 22 Highland Ave
- 221 E Hanover Ave
- 42 Highland Ave
Your Personal Tour Guide
Ask me questions while you tour the home.