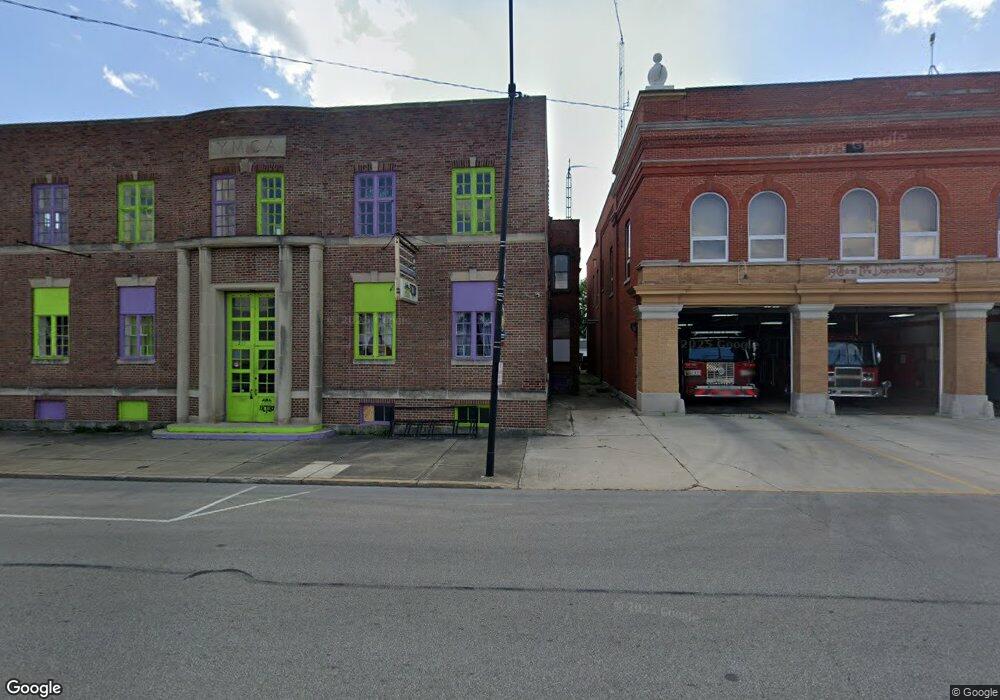
233 E Mansfield St Bucyrus, OH 44820
Estimated Value: $126,472
Studio
--
Bath
16,684
Sq Ft
$8/Sq Ft
Est. Value
About This Home
This home is located at 233 E Mansfield St, Bucyrus, OH 44820 and is currently estimated at $126,472, approximately $7 per square foot. 233 E Mansfield St is a home located in Crawford County with nearby schools including Bucyrus Elementary School, Bucyrus Secondary School, and Holy Trinity School.
Ownership History
Date
Name
Owned For
Owner Type
Purchase Details
Closed on
Jul 8, 2025
Sold by
Green Plate Llc
Bought by
City Of Bucyrus Municipal Corporation
Current Estimated Value
Purchase Details
Closed on
Oct 3, 2024
Sold by
Thoroughman Andy L and Thoroughman Tenia M
Bought by
Green Plate Llc
Purchase Details
Closed on
Apr 1, 2022
Purchase Details
Closed on
Mar 31, 2022
Sold by
Cotsamire Julia C
Bought by
Thoroughman Andy L and Thoroughman Tenia M
Purchase Details
Closed on
Jun 30, 2015
Sold by
Costsamire James G and Cotsamire Julia C
Bought by
Throughman Andy L and Thoroughman Tenia M
Home Financials for this Owner
Home Financials are based on the most recent Mortgage that was taken out on this home.
Original Mortgage
$80,000
Interest Rate
3.9%
Mortgage Type
Seller Take Back
Purchase Details
Closed on
Jun 5, 2015
Sold by
Cotsamire Harriett T
Bought by
Cotsamire Julia C
Home Financials for this Owner
Home Financials are based on the most recent Mortgage that was taken out on this home.
Original Mortgage
$80,000
Interest Rate
3.9%
Mortgage Type
Seller Take Back
Create a Home Valuation Report for This Property
The Home Valuation Report is an in-depth analysis detailing your home's value as well as a comparison with similar homes in the area
Home Values in the Area
Average Home Value in this Area
Purchase History
| Date | Buyer | Sale Price | Title Company |
|---|---|---|---|
| City Of Bucyrus Municipal Corporation | -- | None Listed On Document | |
| City Of Bucyrus Municipal Corporation | -- | None Listed On Document | |
| Green Plate Llc | $115,000 | None Listed On Document | |
| Green Plate Llc | $115,000 | None Listed On Document | |
| -- | -- | -- | |
| Thoroughman Andy L | $80,000 | New Title Company Name | |
| Throughman Andy L | $80,000 | Attorney | |
| Cotsamire Julia C | $85,000 | None Available |
Source: Public Records
Mortgage History
| Date | Status | Borrower | Loan Amount |
|---|---|---|---|
| Previous Owner | Throughman Andy L | $80,000 |
Source: Public Records
Tax History
| Year | Tax Paid | Tax Assessment Tax Assessment Total Assessment is a certain percentage of the fair market value that is determined by local assessors to be the total taxable value of land and additions on the property. | Land | Improvement |
|---|---|---|---|---|
| 2024 | $2,063 | $36,690 | $7,970 | $28,720 |
| 2023 | $2,091 | $42,080 | $7,250 | $34,830 |
| 2022 | $2,775 | $42,080 | $7,250 | $34,830 |
| 2021 | $2,765 | $42,080 | $7,250 | $34,830 |
| 2020 | $2,774 | $42,080 | $7,250 | $34,830 |
| 2019 | $2,852 | $42,080 | $7,250 | $34,830 |
| 2018 | $2,870 | $42,080 | $7,250 | $34,830 |
| 2017 | $2,012 | $28,000 | $5,550 | $22,450 |
| 2016 | $1,939 | $28,000 | $5,550 | $22,450 |
| 2015 | $1,913 | $28,000 | $5,550 | $22,450 |
| 2014 | $2,857 | $42,970 | $5,550 | $37,420 |
| 2013 | $2,857 | $42,970 | $5,550 | $37,420 |
Source: Public Records
Map
Nearby Homes
- 223 E Rensselaer St
- 231 E Rensselaer St
- 210 N Walnut St
- 407 E Mansfield St
- 412 E Rensselaer St
- 320 S Lane St
- 112 Iron St
- 444 Woodlawn Ave
- 400 W Mansfield St
- 118 E Liberty St
- 545 S Sandusky Ave
- 346 Hopley Ave
- 708 S Sandusky Ave
- 941 Reid St
- 627 W Mansfield St
- 609 W Perry St
- 800 High St
- 1201 Reid St
- 1220 E Warren St
- 926 Maple St
- 223 E Mansfield St
- 255 E Mansfield St
- 222 E Rensselaer St
- 236 E Rensselaer St
- 116 S Walnut St
- 116 S Walnut St
- 116 S Walnut St
- 240 E Rensselaer St
- 223 E Rensselaer St
- 108 N Lane St
- 310 E Mansfield St
- 235 E Rensselaer St
- 312 E Mansfield St
- 113 E Mansfield St
- 317 E Mansfield St
- 314 E Mansfield St
- 129 S Walnut St
- 208 S Walnut St
- 115 S East St
- 320 E Rensselaer St