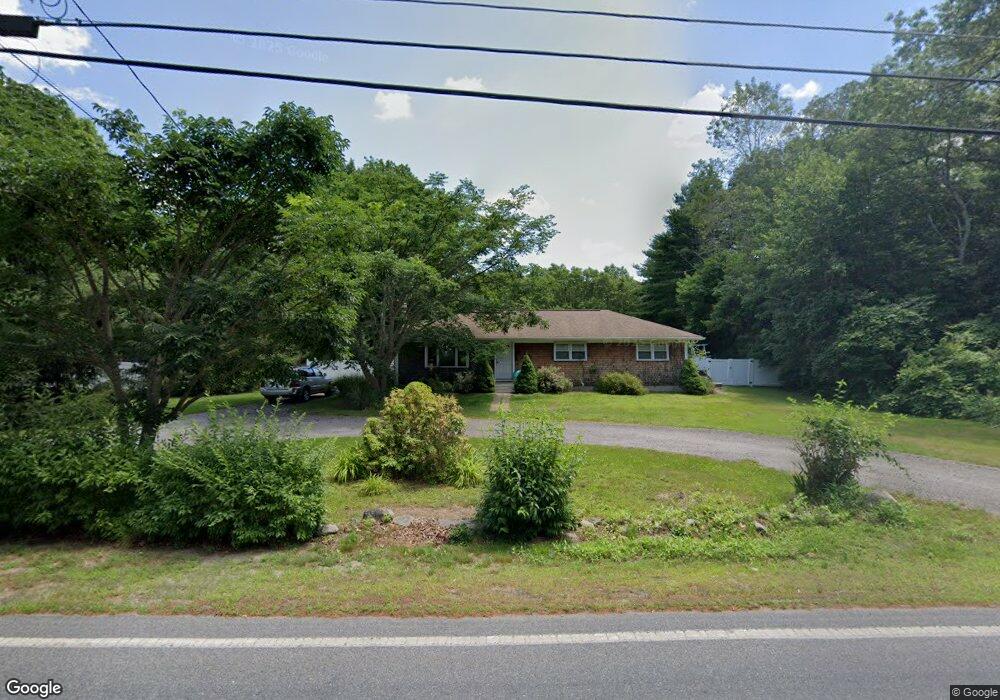
233 Elm St Hanson, MA 02341
Estimated Value: $469,000 - $520,001
3
Beds
2
Baths
1,248
Sq Ft
$393/Sq Ft
Est. Value
About This Home
This home is located at 233 Elm St, Hanson, MA 02341 and is currently estimated at $491,000, approximately $393 per square foot. 233 Elm St is a home located in Plymouth County.
Ownership History
Date
Name
Owned For
Owner Type
Purchase Details
Closed on
Aug 15, 2011
Sold by
Lynch Christopher and Lynch Janice M
Bought by
Sullivan Michael A and Sullivan Valery A
Current Estimated Value
Home Financials for this Owner
Home Financials are based on the most recent Mortgage that was taken out on this home.
Original Mortgage
$205,181
Outstanding Balance
$141,667
Interest Rate
4.51%
Mortgage Type
Purchase Money Mortgage
Estimated Equity
$349,333
Purchase Details
Closed on
Feb 8, 2005
Sold by
Elko Constr Corp
Bought by
Lynch Christopher and Lynch Janice M
Purchase Details
Closed on
Dec 28, 2004
Sold by
Mal9one Edward F and Malone Joan M
Bought by
Elko Constr Corp
Create a Home Valuation Report for This Property
The Home Valuation Report is an in-depth analysis detailing your home's value as well as a comparison with similar homes in the area
Home Values in the Area
Average Home Value in this Area
Purchase History
| Date | Buyer | Sale Price | Title Company |
|---|---|---|---|
| Sullivan Michael A | $198,000 | -- | |
| Lynch Christopher | $325,000 | -- | |
| Elko Constr Corp | $650,000 | -- |
Source: Public Records
Mortgage History
| Date | Status | Borrower | Loan Amount |
|---|---|---|---|
| Open | Sullivan Michael A | $205,181 | |
| Previous Owner | Elko Constr Corp | $88,900 | |
| Previous Owner | Elko Constr Corp | $263,000 |
Source: Public Records
Tax History Compared to Growth
Tax History
| Year | Tax Paid | Tax Assessment Tax Assessment Total Assessment is a certain percentage of the fair market value that is determined by local assessors to be the total taxable value of land and additions on the property. | Land | Improvement |
|---|---|---|---|---|
| 2025 | $5,276 | $394,300 | $173,900 | $220,400 |
| 2024 | $4,676 | $349,500 | $168,900 | $180,600 |
| 2023 | $4,669 | $329,300 | $168,900 | $160,400 |
| 2022 | $4,560 | $302,200 | $153,500 | $148,700 |
| 2021 | $4,095 | $271,200 | $147,600 | $123,600 |
| 2020 | $4,036 | $264,300 | $142,600 | $121,700 |
| 2019 | $3,926 | $252,800 | $139,900 | $112,900 |
| 2018 | $3,880 | $245,100 | $134,500 | $110,600 |
| 2017 | $3,731 | $233,500 | $128,100 | $105,400 |
| 2016 | $3,820 | $230,800 | $128,100 | $102,700 |
| 2015 | $3,641 | $228,700 | $128,100 | $100,600 |
Source: Public Records
Map
Nearby Homes