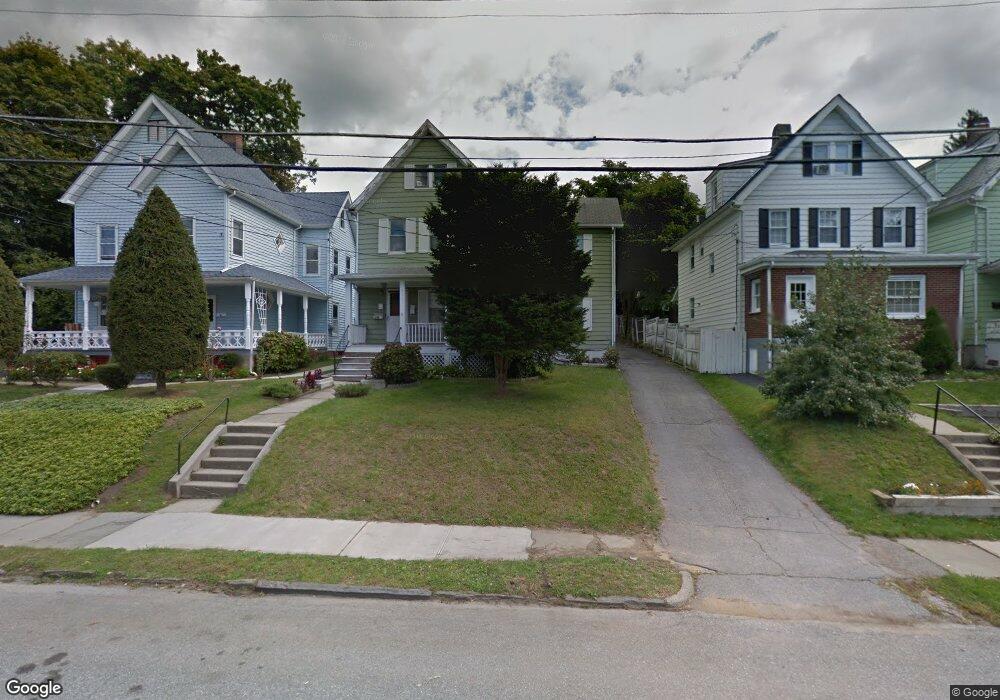
233 Fremont St Peekskill, NY 10566
Estimated Value: $436,474 - $727,000
--
Bed
--
Bath
1,850
Sq Ft
$328/Sq Ft
Est. Value
About This Home
This home is located at 233 Fremont St, Peekskill, NY 10566 and is currently estimated at $606,619, approximately $327 per square foot. 233 Fremont St is a home located in Westchester County with nearby schools including Woodside Elementary School, Oakside School, and Hillcrest School.
Ownership History
Date
Name
Owned For
Owner Type
Purchase Details
Closed on
Apr 18, 2006
Sold by
Cochancela Lucio
Bought by
Cochancela Lucio and Chimbo Maria
Current Estimated Value
Purchase Details
Closed on
Nov 7, 2001
Sold by
Cochancela Lucio and Mendoza Griselda
Bought by
Cochancela Lucio
Purchase Details
Closed on
Sep 15, 2000
Sold by
Reif Freemont E and Reif Marilyn
Bought by
Cochancela Lucio and Mendoza Grisaldo
Home Financials for this Owner
Home Financials are based on the most recent Mortgage that was taken out on this home.
Original Mortgage
$194,750
Interest Rate
7.83%
Mortgage Type
Unknown
Create a Home Valuation Report for This Property
The Home Valuation Report is an in-depth analysis detailing your home's value as well as a comparison with similar homes in the area
Home Values in the Area
Average Home Value in this Area
Purchase History
| Date | Buyer | Sale Price | Title Company |
|---|---|---|---|
| Cochancela Lucio | -- | None Available | |
| Cochancela Lucio | -- | The Title Guarantee Company | |
| Cochancela Lucio | $205,000 | Chicago Title Insurance Co |
Source: Public Records
Mortgage History
| Date | Status | Borrower | Loan Amount |
|---|---|---|---|
| Previous Owner | Cochancela Lucio | $194,750 |
Source: Public Records
Tax History Compared to Growth
Tax History
| Year | Tax Paid | Tax Assessment Tax Assessment Total Assessment is a certain percentage of the fair market value that is determined by local assessors to be the total taxable value of land and additions on the property. | Land | Improvement |
|---|---|---|---|---|
| 2024 | $12,956 | $11,800 | $1,300 | $10,500 |
| 2023 | $12,721 | $11,800 | $1,300 | $10,500 |
| 2022 | $13,603 | $11,800 | $1,300 | $10,500 |
| 2021 | $15,510 | $11,800 | $1,300 | $10,500 |
| 2020 | $13,057 | $11,800 | $1,300 | $10,500 |
| 2019 | $10,980 | $11,800 | $1,300 | $10,500 |
| 2018 | $2,893 | $11,800 | $1,300 | $10,500 |
| 2017 | $0 | $11,800 | $1,300 | $10,500 |
| 2016 | $9,844 | $11,800 | $1,300 | $10,500 |
| 2015 | -- | $11,800 | $1,300 | $10,500 |
| 2014 | $4,464 | $11,800 | $1,300 | $10,500 |
| 2013 | $4,464 | $11,800 | $1,300 | $10,500 |
Source: Public Records
Map
Nearby Homes
- 226 Walnut St
- 334 Union Ave
- 1120 Elm St
- 317 Ringgold St
- 728 Frost Ave
- 125 Depew St Unit C
- 1219 S Division St
- 527 Union Ave
- 410 Dyckman St
- 1430 Riverview Ave
- 1510 Maple Ave
- 1434 Elm St
- 609 Ridge St
- 1356 Longview Ave
- 1204 Main St
- Lots 49, 50 & 68 Somerset Ln
- Lots 8, 9 & 10 Dale Ave
- 710 Main St
- 1475 Elm St
- 229 Nelson Ave