Estimated Value: $245,930 - $315,000
3
Beds
2
Baths
1,586
Sq Ft
$169/Sq Ft
Est. Value
About This Home
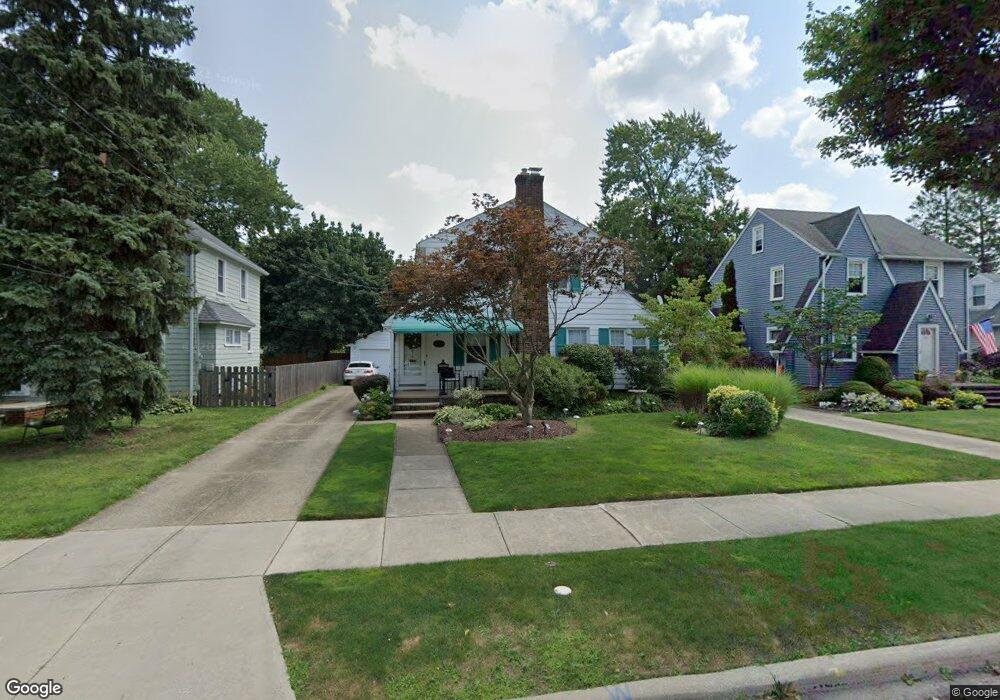
This home is located at 233 Gibson St, Berea, OH 44017 and is currently estimated at $268,733, approximately $169 per square foot. 233 Gibson St is a home located in Cuyahoga County with nearby schools including Grindstone Elementary School, Berea-Midpark Middle School, and Berea-Midpark High School.
Ownership History
Date
Name
Owned For
Owner Type
Purchase Details
Closed on
Mar 24, 2011
Sold by
Last Will & Testament Of Istrene E Johns and Kozie William
Bought by
Karthan Calli A
Current Estimated Value
Home Financials for this Owner
Home Financials are based on the most recent Mortgage that was taken out on this home.
Original Mortgage
$89,455
Outstanding Balance
$61,349
Interest Rate
4.75%
Mortgage Type
FHA
Estimated Equity
$207,384
Purchase Details
Closed on
Jan 27, 1994
Sold by
Johns Griffith T and Johns Istrene E
Bought by
Johns Istrene E
Purchase Details
Closed on
Jan 1, 1975
Bought by
Johns Griffith T and Johns Istrene E
Create a Home Valuation Report for This Property
The Home Valuation Report is an in-depth analysis detailing your home's value as well as a comparison with similar homes in the area
Home Values in the Area
Average Home Value in this Area
Purchase History
| Date | Buyer | Sale Price | Title Company |
|---|---|---|---|
| Karthan Calli A | $98,000 | City Title Agency | |
| Johns Istrene E | -- | -- | |
| Johns Griffith T | -- | -- |
Source: Public Records
Mortgage History
| Date | Status | Borrower | Loan Amount |
|---|---|---|---|
| Open | Karthan Calli A | $89,455 |
Source: Public Records
Tax History Compared to Growth
Tax History
| Year | Tax Paid | Tax Assessment Tax Assessment Total Assessment is a certain percentage of the fair market value that is determined by local assessors to be the total taxable value of land and additions on the property. | Land | Improvement |
|---|---|---|---|---|
| 2024 | $4,314 | $74,620 | $11,165 | $63,455 |
| 2023 | $4,895 | $53,840 | $8,930 | $44,910 |
| 2022 | $3,695 | $53,830 | $8,930 | $44,910 |
| 2021 | $3,664 | $53,830 | $8,930 | $44,910 |
| 2020 | $3,498 | $45,610 | $7,560 | $38,050 |
| 2019 | $3,405 | $130,300 | $21,600 | $108,700 |
| 2018 | $2,966 | $45,610 | $7,560 | $38,050 |
| 2017 | $2,744 | $34,300 | $7,210 | $27,090 |
| 2016 | $2,724 | $34,300 | $7,210 | $27,090 |
| 2015 | $2,574 | $34,300 | $7,210 | $27,090 |
| 2014 | $2,574 | $34,300 | $7,210 | $27,090 |
Source: Public Records
Map
Nearby Homes