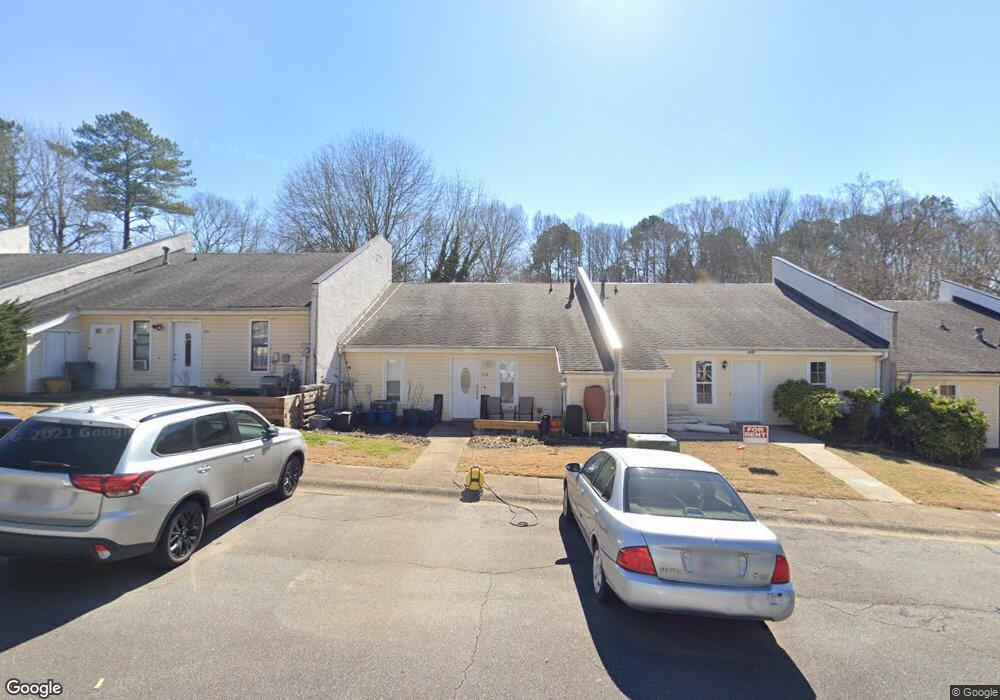
233 Goshen Ln Woodstock, GA 30188
Estimated Value: $273,000 - $305,000
3
Beds
2
Baths
1,354
Sq Ft
$208/Sq Ft
Est. Value
About This Home
This home is located at 233 Goshen Ln, Woodstock, GA 30188 and is currently estimated at $281,945, approximately $208 per square foot. 233 Goshen Ln is a home located in Cherokee County with nearby schools including Woodstock Elementary School, Woodstock Middle School, and Woodstock High School.
Ownership History
Date
Name
Owned For
Owner Type
Purchase Details
Closed on
Aug 31, 2024
Sold by
Sweeney Tara M
Bought by
Weinstein Gregory J
Current Estimated Value
Purchase Details
Closed on
Nov 16, 2018
Sold by
Parris Kenneth V
Bought by
Weinstein Gregory J and Sweeney Tara M
Home Financials for this Owner
Home Financials are based on the most recent Mortgage that was taken out on this home.
Original Mortgage
$103,098
Interest Rate
4.8%
Mortgage Type
FHA
Purchase Details
Closed on
Apr 29, 2016
Sold by
Lineback Mary Pamela
Bought by
Parris Kenneth V and Parris Martha J
Home Financials for this Owner
Home Financials are based on the most recent Mortgage that was taken out on this home.
Original Mortgage
$138,000
Interest Rate
3.99%
Mortgage Type
Reverse Mortgage Home Equity Conversion Mortgage
Purchase Details
Closed on
Apr 5, 2013
Sold by
Parris Martha J
Bought by
Parris Kenneth V and Parris Kenneth Alan
Create a Home Valuation Report for This Property
The Home Valuation Report is an in-depth analysis detailing your home's value as well as a comparison with similar homes in the area
Home Values in the Area
Average Home Value in this Area
Purchase History
| Date | Buyer | Sale Price | Title Company |
|---|---|---|---|
| Weinstein Gregory J | -- | -- | |
| Weinstein Gregory J | $105,000 | -- | |
| Parris Kenneth V | -- | -- | |
| Parris Kenneth V | -- | -- |
Source: Public Records
Mortgage History
| Date | Status | Borrower | Loan Amount |
|---|---|---|---|
| Previous Owner | Weinstein Gregory J | $103,098 | |
| Previous Owner | Parris Kenneth V | $138,000 |
Source: Public Records
Tax History Compared to Growth
Tax History
| Year | Tax Paid | Tax Assessment Tax Assessment Total Assessment is a certain percentage of the fair market value that is determined by local assessors to be the total taxable value of land and additions on the property. | Land | Improvement |
|---|---|---|---|---|
| 2024 | $2,425 | $85,560 | $18,800 | $66,760 |
| 2023 | $519 | $90,960 | $20,800 | $70,160 |
| 2022 | $2,062 | $69,400 | $16,000 | $53,400 |
| 2021 | $1,585 | $63,160 | $13,320 | $49,840 |
| 2020 | $1,863 | $57,680 | $12,000 | $45,680 |
| 2019 | $1,055 | $41,960 | $8,800 | $33,160 |
| 2018 | $156 | $38,080 | $8,800 | $29,280 |
| 2017 | $144 | $84,400 | $7,200 | $26,560 |
| 2016 | $144 | $68,500 | $6,400 | $21,000 |
| 2015 | $141 | $65,400 | $6,400 | $19,760 |
| 2014 | $110 | $53,600 | $6,400 | $15,040 |
Source: Public Records
Map
Nearby Homes
- 231 Goshen Ln
- 237 Goshen Ln
- 229 Goshen Ln
- 227 Goshen Ln
- 225 Goshen Ln
- 223 Goshen Ln
- 228 Goshen Ln
- 0 Goshen Ln Unit 7336159
- 0 Goshen Ln Unit 3236234
- 0 Goshen Ln Unit 3209548
- 0 Goshen Ln Unit 8604308
- 230 Goshen Ln
- 230 Goshen Ln Unit 230
- 226 Goshen Ln
- 232 Goshen Ln
- 224 Goshen Ln
- 234 Goshen Ln
- 222 Goshen Ln
- 219 Goshen Ln
- 220 Goshen Ln