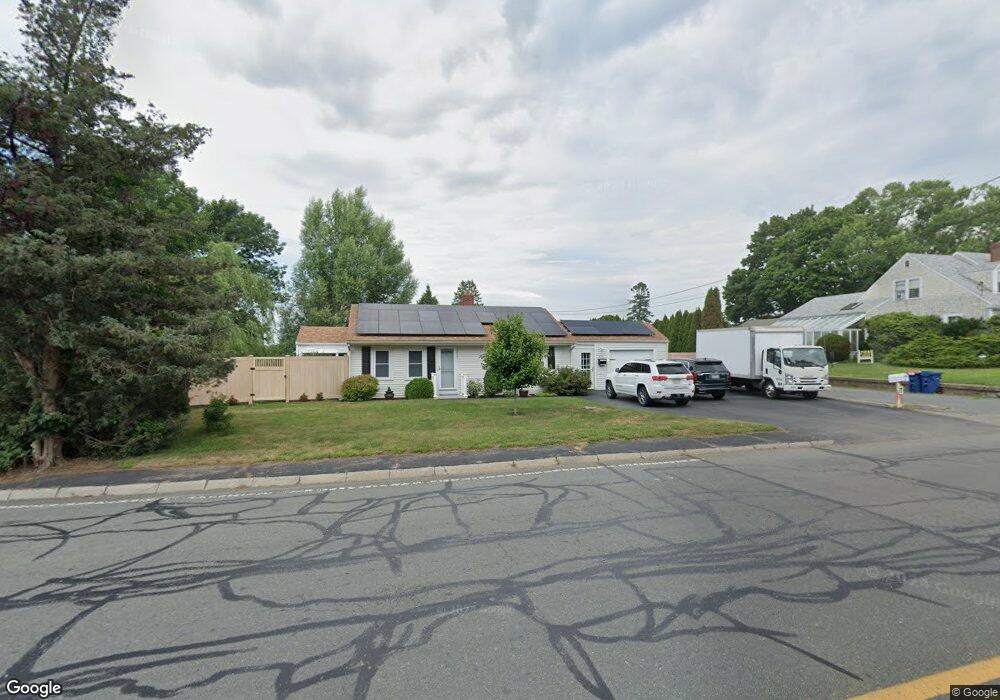
233 Hathaway Rd New Bedford, MA 02746
Riverside Park NeighborhoodEstimated Value: $376,000 - $390,686
2
Beds
1
Bath
884
Sq Ft
$432/Sq Ft
Est. Value
About This Home
This home is located at 233 Hathaway Rd, New Bedford, MA 02746 and is currently estimated at $382,172, approximately $432 per square foot. 233 Hathaway Rd is a home located in Bristol County with nearby schools including Carlos Pacheco Elementary School, Keith Middle School, and New Bedford High School.
Ownership History
Date
Name
Owned For
Owner Type
Purchase Details
Closed on
Sep 18, 2003
Sold by
Alves Barry A
Bought by
Demello Scott
Current Estimated Value
Home Financials for this Owner
Home Financials are based on the most recent Mortgage that was taken out on this home.
Original Mortgage
$171,000
Interest Rate
6.31%
Mortgage Type
Purchase Money Mortgage
Purchase Details
Closed on
Jul 1, 1998
Sold by
Koska Peter M
Bought by
Alves Barry A
Create a Home Valuation Report for This Property
The Home Valuation Report is an in-depth analysis detailing your home's value as well as a comparison with similar homes in the area
Home Values in the Area
Average Home Value in this Area
Purchase History
| Date | Buyer | Sale Price | Title Company |
|---|---|---|---|
| Demello Scott | $180,000 | -- | |
| Demello Scott | $180,000 | -- | |
| Alves Barry A | $85,500 | -- | |
| Alves Barry A | $85,500 | -- |
Source: Public Records
Mortgage History
| Date | Status | Borrower | Loan Amount |
|---|---|---|---|
| Open | Alves Barry A | $210,000 | |
| Closed | Alves Barry A | $171,000 | |
| Previous Owner | Alves Barry A | $20,000 |
Source: Public Records
Tax History Compared to Growth
Tax History
| Year | Tax Paid | Tax Assessment Tax Assessment Total Assessment is a certain percentage of the fair market value that is determined by local assessors to be the total taxable value of land and additions on the property. | Land | Improvement |
|---|---|---|---|---|
| 2025 | $3,996 | $353,300 | $125,700 | $227,600 |
| 2024 | $3,761 | $313,400 | $130,100 | $183,300 |
| 2023 | $3,721 | $260,400 | $104,000 | $156,400 |
| 2022 | $3,472 | $223,400 | $99,700 | $123,700 |
| 2021 | $3,350 | $214,900 | $95,400 | $119,500 |
| 2020 | $3,371 | $208,600 | $95,400 | $113,200 |
| 2019 | $3,282 | $199,300 | $95,400 | $103,900 |
| 2018 | $3,106 | $186,800 | $95,400 | $91,400 |
| 2017 | $2,932 | $175,700 | $91,000 | $84,700 |
| 2016 | $2,683 | $162,700 | $86,700 | $76,000 |
| 2015 | $2,534 | $161,100 | $86,700 | $74,400 |
| 2014 | $2,483 | $163,800 | $88,900 | $74,900 |
Source: Public Records
Map
Nearby Homes
- 177 Buchanan St
- 28 Harvard St
- 129 Rowe St
- 71 Highland St
- 70-72 Highland St
- 100 Peckham St
- 24 Acorn St
- 81 Durfee St
- 498-500 Coggeshall St
- 96 Mount Pleasant St
- 70 Trinity St
- 69 Mount Pleasant St
- 18 Edison St
- 101 Willow St
- 301 Davis St
- 194 Robeson St
- 20 Lafrance Ct
- 161 Deane St
- 193 Ashley Blvd
- 212 Weld St