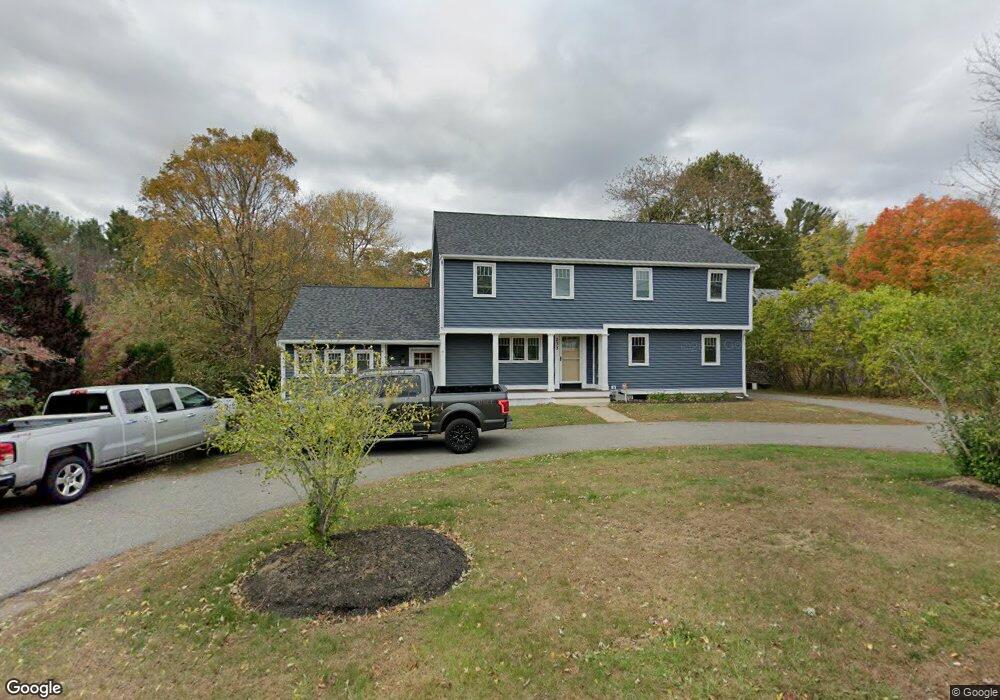
233 High St Hanson, MA 02341
Estimated Value: $750,276 - $872,000
5
Beds
4
Baths
2,718
Sq Ft
$295/Sq Ft
Est. Value
About This Home
This home is located at 233 High St, Hanson, MA 02341 and is currently estimated at $801,319, approximately $294 per square foot. 233 High St is a home located in Plymouth County.
Ownership History
Date
Name
Owned For
Owner Type
Purchase Details
Closed on
Apr 9, 1987
Sold by
Colby Donald A
Bought by
Croghan Patrick M
Current Estimated Value
Home Financials for this Owner
Home Financials are based on the most recent Mortgage that was taken out on this home.
Original Mortgage
$85,000
Interest Rate
9.02%
Mortgage Type
Purchase Money Mortgage
Create a Home Valuation Report for This Property
The Home Valuation Report is an in-depth analysis detailing your home's value as well as a comparison with similar homes in the area
Home Values in the Area
Average Home Value in this Area
Purchase History
| Date | Buyer | Sale Price | Title Company |
|---|---|---|---|
| Croghan Patrick M | $130,000 | -- |
Source: Public Records
Mortgage History
| Date | Status | Borrower | Loan Amount |
|---|---|---|---|
| Open | Croghan Patrick M | $121,000 | |
| Closed | Croghan Patrick M | $94,500 | |
| Closed | Croghan Patrick M | $85,000 |
Source: Public Records
Tax History Compared to Growth
Tax History
| Year | Tax Paid | Tax Assessment Tax Assessment Total Assessment is a certain percentage of the fair market value that is determined by local assessors to be the total taxable value of land and additions on the property. | Land | Improvement |
|---|---|---|---|---|
| 2025 | $9,121 | $681,700 | $182,200 | $499,500 |
| 2024 | $8,860 | $662,200 | $176,900 | $485,300 |
| 2023 | $8,524 | $601,100 | $176,900 | $424,200 |
| 2022 | $8,253 | $546,900 | $160,800 | $386,100 |
| 2021 | $7,470 | $494,700 | $154,700 | $340,000 |
| 2020 | $7,307 | $478,500 | $149,400 | $329,100 |
| 2019 | $4,437 | $285,700 | $146,500 | $139,200 |
| 2018 | $5,716 | $406,900 | $140,900 | $266,000 |
| 2017 | $6,258 | $391,600 | $134,200 | $257,400 |
| 2016 | $6,297 | $380,500 | $134,200 | $246,300 |
| 2015 | $5,968 | $374,900 | $134,200 | $240,700 |
Source: Public Records
Map
Nearby Homes