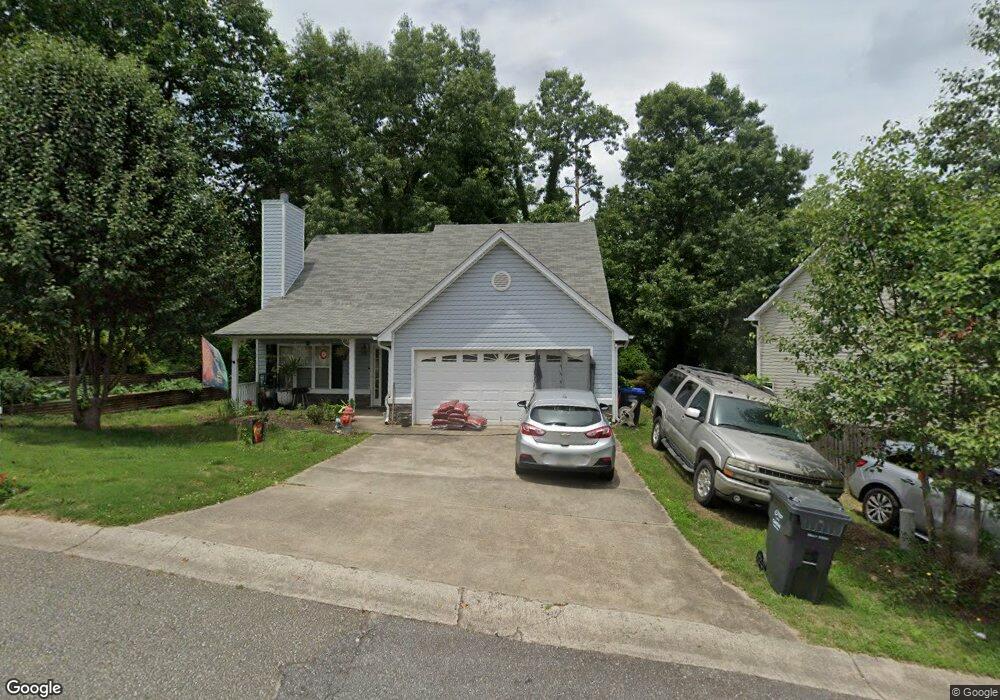
233 Hillcrest Ridge Canton, GA 30115
Estimated Value: $320,000 - $333,622
4
Beds
2
Baths
1,480
Sq Ft
$221/Sq Ft
Est. Value
About This Home
This home is located at 233 Hillcrest Ridge, Canton, GA 30115 and is currently estimated at $326,811, approximately $220 per square foot. 233 Hillcrest Ridge is a home located in Cherokee County with nearby schools including Indian Knoll Elementary School, Rusk Middle School, and Sequoyah High School.
Ownership History
Date
Name
Owned For
Owner Type
Purchase Details
Closed on
Apr 16, 2019
Sold by
Floyd Matthew Dean
Bought by
Long Terrell
Current Estimated Value
Home Financials for this Owner
Home Financials are based on the most recent Mortgage that was taken out on this home.
Original Mortgage
$157,102
Outstanding Balance
$141,318
Interest Rate
5.62%
Mortgage Type
FHA
Estimated Equity
$185,493
Purchase Details
Closed on
Sep 7, 2000
Sold by
A C A Properties Llc
Bought by
Floyd Matthew D and Floyd Peggy M
Home Financials for this Owner
Home Financials are based on the most recent Mortgage that was taken out on this home.
Original Mortgage
$110,850
Interest Rate
7.92%
Mortgage Type
FHA
Purchase Details
Closed on
Jul 31, 1998
Sold by
Genesis Constr Co Inc
Bought by
Daugherty Timothy D
Home Financials for this Owner
Home Financials are based on the most recent Mortgage that was taken out on this home.
Original Mortgage
$108,250
Interest Rate
6.97%
Mortgage Type
FHA
Create a Home Valuation Report for This Property
The Home Valuation Report is an in-depth analysis detailing your home's value as well as a comparison with similar homes in the area
Home Values in the Area
Average Home Value in this Area
Purchase History
| Date | Buyer | Sale Price | Title Company |
|---|---|---|---|
| Long Terrell | $160,000 | -- | |
| Floyd Matthew D | $111,900 | -- | |
| Daugherty Timothy D | $108,300 | -- |
Source: Public Records
Mortgage History
| Date | Status | Borrower | Loan Amount |
|---|---|---|---|
| Open | Long Terrell | $157,102 | |
| Closed | Long Terrell | $5,600 | |
| Previous Owner | Floyd Matthew D | $110,850 | |
| Previous Owner | Daugherty Timothy D | $108,250 |
Source: Public Records
Tax History Compared to Growth
Tax History
| Year | Tax Paid | Tax Assessment Tax Assessment Total Assessment is a certain percentage of the fair market value that is determined by local assessors to be the total taxable value of land and additions on the property. | Land | Improvement |
|---|---|---|---|---|
| 2025 | $2,803 | $108,016 | $26,000 | $82,016 |
| 2024 | $2,746 | $105,216 | $25,600 | $79,616 |
| 2023 | $3,026 | $116,760 | $25,600 | $91,160 |
| 2022 | $2,334 | $87,600 | $20,800 | $66,800 |
| 2021 | $2,017 | $69,200 | $16,000 | $53,200 |
| 2020 | $1,887 | $64,000 | $13,922 | $50,078 |
| 2019 | $1,801 | $63,240 | $14,000 | $49,240 |
| 2018 | $1,556 | $53,280 | $12,400 | $40,880 |
| 2017 | $1,234 | $127,800 | $12,400 | $38,720 |
| 2016 | $1,234 | $126,500 | $10,400 | $40,200 |
| 2015 | $1,104 | $112,800 | $10,400 | $34,720 |
| 2014 | $1,189 | $97,500 | $8,800 | $30,200 |
Source: Public Records
Map
Nearby Homes
- 254 Hillcrest Ridge Unit 2
- 201 Hillcrest Ridge
- 312 Hillcrest Ln
- 3789 Cherokee Overlook Dr
- 832 Overlook Trail
- 3714 Cherokee Overlook Dr Unit 2
- 209 Forest Trace
- 809 Overlook Trail
- 3548 Cherokee Overlook Dr
- 365 Russell King Ln
- 231 Breeze Hill Ln
- 302 and 304 Garland Way
- 701 Longview Dr
- 0 Reed St Unit 7646438
- 240 Rose Ridge Dr
- 120 Jeanette St
- 727 Lower Scott Mill Rd
- 253 Newt Fowler Ln
- 459 Lower Scott Mill Rd
- 0 Governors Walk Dr Unit 7294252
- 235 Hillcrest Ridge
- 235 R Hillcrest Ridge
- 231 Hillcrest Ridge
- 235R Hillcrest Dr
- 237 Hillcrest Ridge
- 251 Hillcrest Ridge Unit II
- 253 Hillcrest Ridge
- 249 Hillcrest Ridge
- 229 Hillcrest Ridge
- 253 Hillcrest Ridge
- 239 Hillcrest Ridge Unit II
- 228 Hillcrest Ridge
- 226 Hillcrest Ridge Unit II
- 230 Hillcrest Ridge
- 224 Hillcrest Ridge Unit 1
- 232 Hillcrest Ridge
- 247 Hillcrest Ridge Unit II
- 247 Hillcrest Ridge
- 255 Hillcrest Ridge Unit II
- 234 Hillcrest Ridge