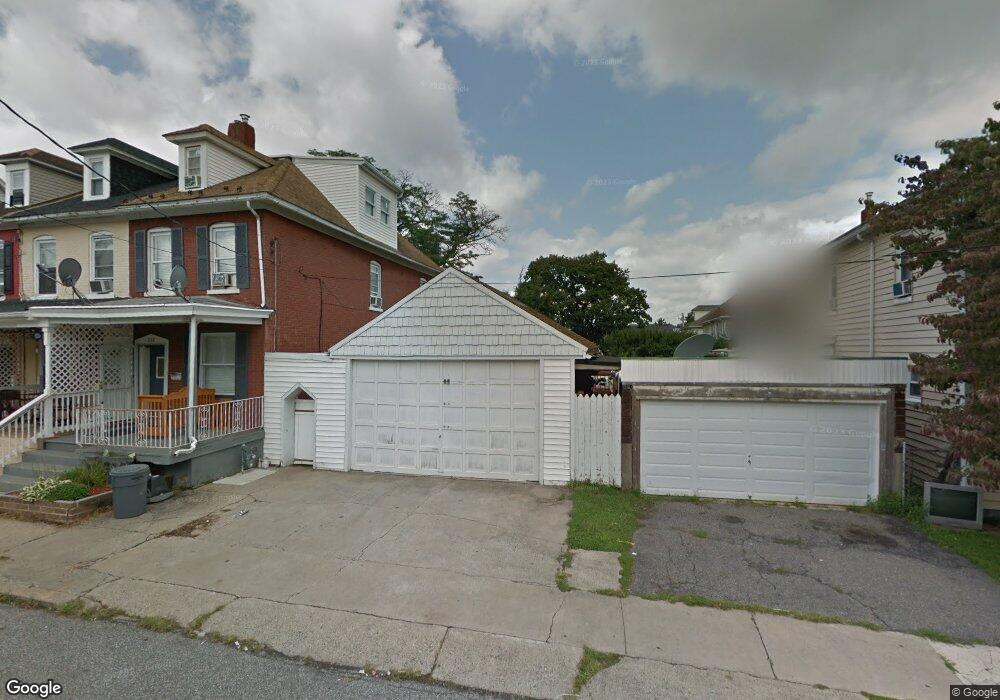
233 Hudson St Phillipsburg, NJ 08865
Estimated Value: $216,244 - $256,000
--
Bed
--
Bath
1,516
Sq Ft
$154/Sq Ft
Est. Value
About This Home
This home is located at 233 Hudson St, Phillipsburg, NJ 08865 and is currently estimated at $233,811, approximately $154 per square foot. 233 Hudson St is a home with nearby schools including Phillipsburg High School, Easton Arts Academy Elementary Cs, and Sts. Philip & James School.
Ownership History
Date
Name
Owned For
Owner Type
Purchase Details
Closed on
Nov 14, 2020
Sold by
Beam Flor Maria
Bought by
Munoz Yorleny
Current Estimated Value
Purchase Details
Closed on
Dec 15, 2010
Sold by
Hummer James and Hummer Sally Ann
Bought by
Beam Flor Maria
Home Financials for this Owner
Home Financials are based on the most recent Mortgage that was taken out on this home.
Original Mortgage
$75,000
Outstanding Balance
$48,993
Interest Rate
4%
Mortgage Type
Seller Take Back
Estimated Equity
$184,818
Create a Home Valuation Report for This Property
The Home Valuation Report is an in-depth analysis detailing your home's value as well as a comparison with similar homes in the area
Home Values in the Area
Average Home Value in this Area
Purchase History
| Date | Buyer | Sale Price | Title Company |
|---|---|---|---|
| Munoz Yorleny | -- | None Available | |
| Beam Flor Maria | $110,000 | None Available |
Source: Public Records
Mortgage History
| Date | Status | Borrower | Loan Amount |
|---|---|---|---|
| Open | Beam Flor Maria | $75,000 |
Source: Public Records
Tax History Compared to Growth
Tax History
| Year | Tax Paid | Tax Assessment Tax Assessment Total Assessment is a certain percentage of the fair market value that is determined by local assessors to be the total taxable value of land and additions on the property. | Land | Improvement |
|---|---|---|---|---|
| 2025 | $4,518 | $99,400 | $27,300 | $72,100 |
| 2024 | $4,171 | $99,400 | $27,300 | $72,100 |
| 2023 | $4,123 | $99,400 | $27,300 | $72,100 |
| 2022 | $4,123 | $99,400 | $27,300 | $72,100 |
| 2021 | $3,991 | $99,400 | $27,300 | $72,100 |
| 2020 | $4,018 | $99,400 | $27,300 | $72,100 |
| 2019 | $3,957 | $99,400 | $27,300 | $72,100 |
| 2018 | $3,957 | $99,400 | $27,300 | $72,100 |
| 2017 | $3,939 | $99,400 | $27,300 | $72,100 |
| 2016 | $3,879 | $99,400 | $27,300 | $72,100 |
| 2015 | $3,849 | $99,400 | $27,300 | $72,100 |
| 2014 | $3,724 | $99,400 | $27,300 | $72,100 |
Source: Public Records
Map
Nearby Homes