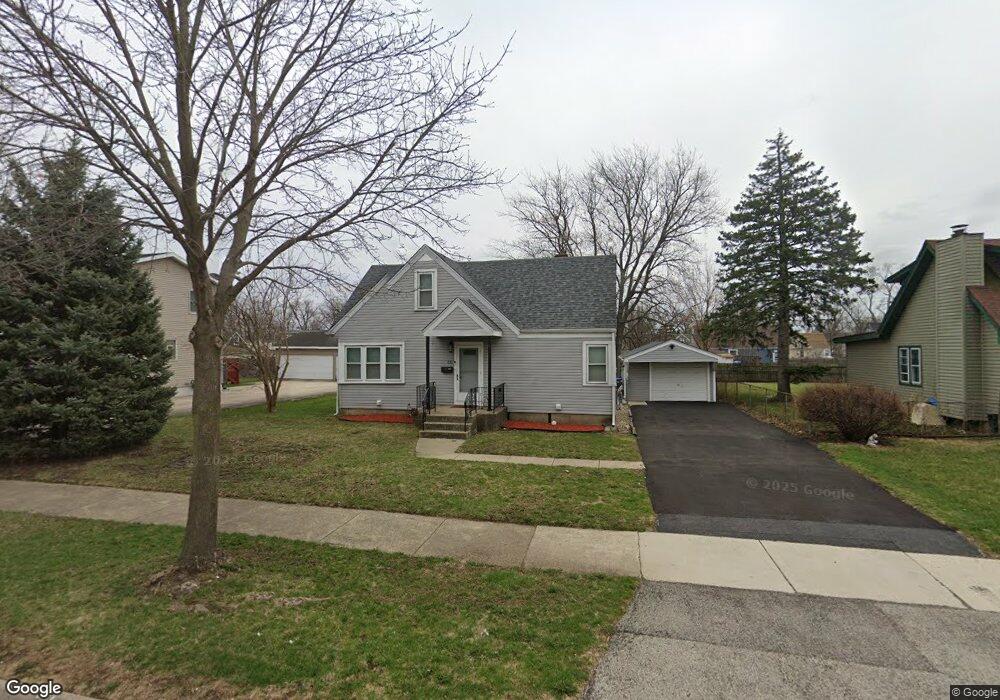
233 Macarthur Dr Northlake, IL 60164
Estimated Value: $282,000 - $315,250
3
Beds
1
Bath
1,290
Sq Ft
$237/Sq Ft
Est. Value
About This Home
This home is located at 233 Macarthur Dr, Northlake, IL 60164 and is currently estimated at $305,563, approximately $236 per square foot. 233 Macarthur Dr is a home located in Cook County with nearby schools including Roy Elementary School, Mannheim Middle School, and West Leyden High School.
Ownership History
Date
Name
Owned For
Owner Type
Purchase Details
Closed on
Nov 18, 2024
Sold by
5M Properties Corp
Bought by
Reyes Estefania and Urbina Joshua
Current Estimated Value
Home Financials for this Owner
Home Financials are based on the most recent Mortgage that was taken out on this home.
Original Mortgage
$315,250
Outstanding Balance
$311,764
Interest Rate
6.99%
Mortgage Type
New Conventional
Estimated Equity
-$6,201
Purchase Details
Closed on
Jul 25, 2024
Sold by
Farias Patricia A
Bought by
5M Properties Corp
Purchase Details
Closed on
Jul 1, 2024
Sold by
Dpa Chicago Llc
Bought by
5M Properties Corp
Purchase Details
Closed on
Jan 4, 2001
Sold by
Struck Katherine A and Link Joseph P
Bought by
Farias Donald and Farias Patricia A
Home Financials for this Owner
Home Financials are based on the most recent Mortgage that was taken out on this home.
Original Mortgage
$140,100
Interest Rate
7.77%
Create a Home Valuation Report for This Property
The Home Valuation Report is an in-depth analysis detailing your home's value as well as a comparison with similar homes in the area
Home Values in the Area
Average Home Value in this Area
Purchase History
| Date | Buyer | Sale Price | Title Company |
|---|---|---|---|
| Reyes Estefania | $325,000 | Chicago Title Company | |
| 5M Properties Corp | $165,000 | Lakeland Title | |
| 5M Properties Corp | $190,000 | None Listed On Document | |
| Farias Donald | $147,500 | Mercury Title Company |
Source: Public Records
Mortgage History
| Date | Status | Borrower | Loan Amount |
|---|---|---|---|
| Open | Reyes Estefania | $315,250 | |
| Previous Owner | Farias Donald | $140,100 |
Source: Public Records
Tax History
| Year | Tax Paid | Tax Assessment Tax Assessment Total Assessment is a certain percentage of the fair market value that is determined by local assessors to be the total taxable value of land and additions on the property. | Land | Improvement |
|---|---|---|---|---|
| 2025 | $3,131 | $26,000 | $5,346 | $20,654 |
| 2024 | $3,131 | $21,000 | $4,374 | $16,626 |
| 2023 | $3,223 | $21,000 | $4,374 | $16,626 |
| 2022 | $3,223 | $21,000 | $4,374 | $16,626 |
| 2021 | $3,615 | $15,621 | $3,402 | $12,219 |
| 2020 | $4,958 | $15,621 | $3,402 | $12,219 |
| 2019 | $5,260 | $17,631 | $3,402 | $14,229 |
| 2018 | $5,110 | $15,761 | $2,916 | $12,845 |
| 2017 | $5,109 | $15,761 | $2,916 | $12,845 |
| 2016 | $5,166 | $15,761 | $2,916 | $12,845 |
| 2015 | $4,833 | $14,301 | $2,673 | $11,628 |
| 2014 | $4,760 | $14,301 | $2,673 | $11,628 |
| 2013 | $4,510 | $14,301 | $2,673 | $11,628 |
Source: Public Records
Map
Nearby Homes
- 2756 Landen Dr
- 809 N Wolf Rd
- 10608 Drummond Ave
- 10715 Diversey Ave
- 11030 W Grand Ave
- 10833 Wellington St
- 221 E Dickens Ave
- 44 King Arthur Ct Unit 7
- 10548 Crown Rd
- 10542 Crown Rd
- 365 E Dickens Ave
- 12 King Arthur Ct Unit 11
- 371 E Dickens Ave
- 16 King Arthur Ct Unit 16
- 35 King Arthur Ct Unit 19
- 10417 W Palmer Ave
- 23 King Arthur Ct Unit 6
- 26 King Arthur Ct Unit 4
- 2439 Ernst St
- 2431 Ernst St
- 229 Macarthur Dr
- 237 Macarthur Dr Unit 14
- 232 Wagner Dr
- 225 Macarthur Dr
- 241 Macarthur Dr
- 228 Wagner Dr
- 236 Wagner Dr
- 224 Wagner Dr
- 232 Macarthur Dr
- 240 Wagner Dr
- 228 Macarthur Dr
- 236 Macarthur Dr
- 221 Macarthur Dr
- 245 Macarthur Dr
- 240 Macarthur Dr
- 224 Macarthur Dr
- 220 Wagner Dr
- 217 Macarthur Dr
- 249 Macarthur Dr
Your Personal Tour Guide
Ask me questions while you tour the home.