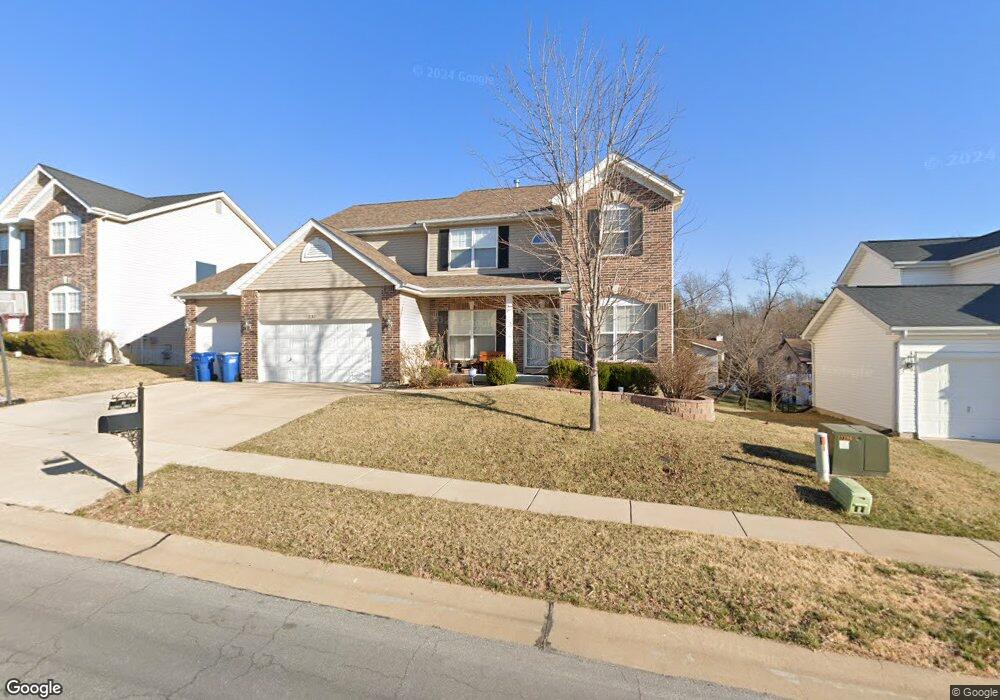
233 Magnolia Trace Dr Ballwin, MO 63021
Estimated Value: $622,000 - $722,000
4
Beds
3
Baths
3,034
Sq Ft
$214/Sq Ft
Est. Value
About This Home
This home is located at 233 Magnolia Trace Dr, Ballwin, MO 63021 and is currently estimated at $650,286, approximately $214 per square foot. 233 Magnolia Trace Dr is a home located in St. Louis County with nearby schools including Oak Brook Elementary School, Parkway Southwest Middle School, and Parkway South High School.
Ownership History
Date
Name
Owned For
Owner Type
Purchase Details
Closed on
Aug 28, 2009
Sold by
Rockwood Homes Llc
Bought by
Rawat Laxman and Kaistha Ruchee
Current Estimated Value
Home Financials for this Owner
Home Financials are based on the most recent Mortgage that was taken out on this home.
Original Mortgage
$260,000
Outstanding Balance
$161,034
Interest Rate
4.25%
Mortgage Type
New Conventional
Estimated Equity
$489,252
Purchase Details
Closed on
Aug 20, 2009
Sold by
Mcbride & Son Homes Inc
Bought by
Rockwood Homes Llc
Home Financials for this Owner
Home Financials are based on the most recent Mortgage that was taken out on this home.
Original Mortgage
$260,000
Outstanding Balance
$161,034
Interest Rate
4.25%
Mortgage Type
New Conventional
Estimated Equity
$489,252
Create a Home Valuation Report for This Property
The Home Valuation Report is an in-depth analysis detailing your home's value as well as a comparison with similar homes in the area
Home Values in the Area
Average Home Value in this Area
Purchase History
| Date | Buyer | Sale Price | Title Company |
|---|---|---|---|
| Rawat Laxman | $355,775 | Sec | |
| Rockwood Homes Llc | $74,000 | None Available |
Source: Public Records
Mortgage History
| Date | Status | Borrower | Loan Amount |
|---|---|---|---|
| Open | Rawat Laxman | $260,000 |
Source: Public Records
Tax History
| Year | Tax Paid | Tax Assessment Tax Assessment Total Assessment is a certain percentage of the fair market value that is determined by local assessors to be the total taxable value of land and additions on the property. | Land | Improvement |
|---|---|---|---|---|
| 2025 | $6,304 | $108,260 | $29,810 | $78,450 |
| 2024 | $6,304 | $97,510 | $21,890 | $75,620 |
| 2023 | $6,215 | $97,510 | $21,890 | $75,620 |
| 2022 | $5,999 | $85,540 | $21,890 | $63,650 |
| 2021 | $5,964 | $85,540 | $21,890 | $63,650 |
| 2020 | $6,318 | $85,900 | $18,240 | $67,660 |
| 2019 | $6,246 | $85,900 | $18,240 | $67,660 |
| 2018 | $6,115 | $78,010 | $18,240 | $59,770 |
| 2017 | $5,940 | $78,010 | $18,240 | $59,770 |
| 2016 | $5,969 | $74,590 | $13,680 | $60,910 |
Source: Public Records
Map
Nearby Homes
- 284 Brightfield Dr
- 533 Golfwood Dr
- 365 Remington Way Dr
- 618 Running Creek Dr
- 417 Palermo Dr
- 134 Cascade Terrace Dr
- 407 Tulsa Ave
- 1239 Bedford Falls Ct
- 318 Statewood Dr
- 756 Alexander Mark Way
- 275 Essen Ct Unit TBB
- 713 Village Wood Ct
- 1389 Red Oak Plantation Dr
- 717 Woodrun Dr
- 537 Treetop Village Dr
- 798 Canary Dr
- 760 Woodside Trails Dr Unit 203
- 604 Pine Ridge Trails Ct Unit 202
- 540 Woodlyn Crossing
- 557 Woodlyn Crossing
- 229 Magnolia Trace Dr
- 237 Magnolia Trace Dr
- 114 Holly Garden Dr
- 118 Holly Garden Dr
- 241 Magnolia Trace Dr
- 225 Magnolia Trace Dr
- 110 Holly Garden Dr
- 122 Holly Garden Dr
- 232 Magnolia Trace Dr
- 236 Magnolia Trace Dr
- 106 Holly Garden Dr
- 245 Magnolia Trace Dr
- 240 Magnolia Trace Dr
- 102 Holly Garden Dr
- 244 Magnolia Trace Dr
- 130 Holly Garden Dr
- 115 Holly Garden Dr
- 111 Holly Garden Dr
- 217 Magnolia Trace Dr
- 107 Holly Garden Dr
Your Personal Tour Guide
Ask me questions while you tour the home.