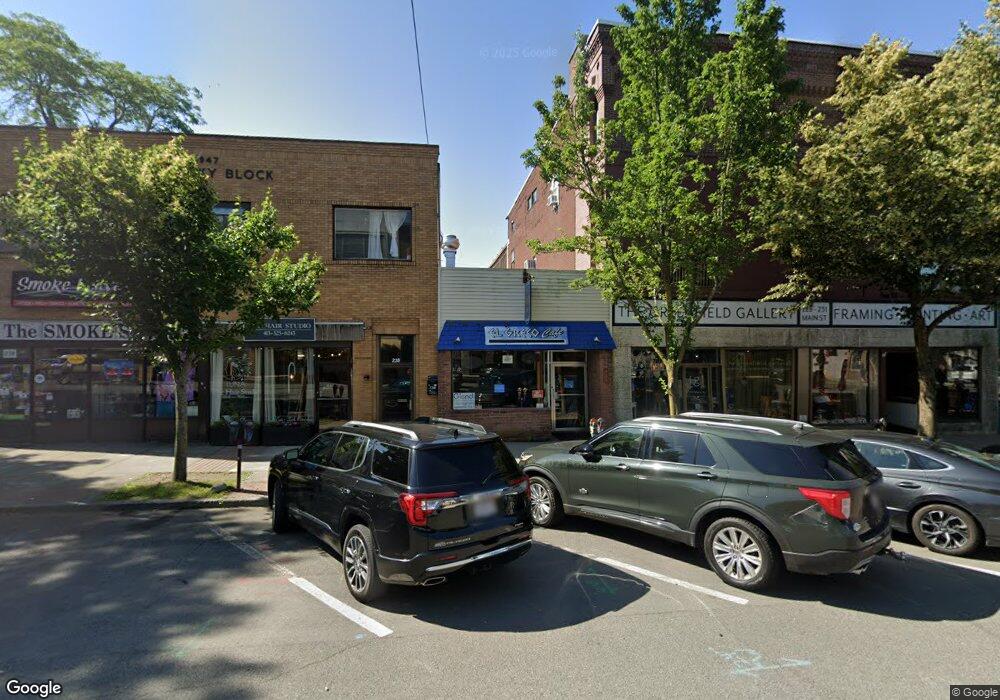
233 Main St Greenfield, MA 01301
Estimated Value: $346,202
Studio
--
Bath
1,578
Sq Ft
$219/Sq Ft
Est. Value
About This Home
This home is located at 233 Main St, Greenfield, MA 01301 and is currently estimated at $346,202, approximately $219 per square foot. 233 Main St is a home located in Franklin County with nearby schools including Greenfield Center School and The Bement School.
Ownership History
Date
Name
Owned For
Owner Type
Purchase Details
Closed on
Feb 22, 2008
Sold by
Sullivan-Jenest Kathleen
Bought by
233 1 Llc
Current Estimated Value
Home Financials for this Owner
Home Financials are based on the most recent Mortgage that was taken out on this home.
Original Mortgage
$160,000
Outstanding Balance
$99,619
Interest Rate
5.9%
Mortgage Type
Commercial
Estimated Equity
$246,583
Purchase Details
Closed on
Mar 4, 1997
Sold by
Sullivan Dorothy M
Bought by
Sullivan-Jenest K M
Create a Home Valuation Report for This Property
The Home Valuation Report is an in-depth analysis detailing your home's value as well as a comparison with similar homes in the area
Home Values in the Area
Average Home Value in this Area
Purchase History
| Date | Buyer | Sale Price | Title Company |
|---|---|---|---|
| 233 1 Llc | $170,000 | -- | |
| 233 1 Llc | $170,000 | -- | |
| Sullivan-Jenest K M | $90,000 | -- | |
| Sullivan-Jenest K M | $90,000 | -- |
Source: Public Records
Mortgage History
| Date | Status | Borrower | Loan Amount |
|---|---|---|---|
| Open | 233 1 Llc | $160,000 | |
| Closed | Sullivan-Jenest K M | $160,000 | |
| Previous Owner | Sullivan-Jenest K M | $20,000 | |
| Previous Owner | Sullivan-Jenest K M | $100,000 |
Source: Public Records
Tax History
| Year | Tax Paid | Tax Assessment Tax Assessment Total Assessment is a certain percentage of the fair market value that is determined by local assessors to be the total taxable value of land and additions on the property. | Land | Improvement |
|---|---|---|---|---|
| 2025 | $3,630 | $185,600 | $53,400 | $132,200 |
| 2024 | $3,733 | $183,100 | $50,900 | $132,200 |
| 2023 | $3,311 | $168,500 | $46,200 | $122,300 |
| 2022 | $3,647 | $163,400 | $44,000 | $119,400 |
| 2021 | $3,855 | $166,000 | $46,600 | $119,400 |
| 2020 | $3,710 | $161,800 | $46,600 | $115,200 |
| 2019 | $3,618 | $161,800 | $46,600 | $115,200 |
| 2018 | $3,329 | $148,400 | $42,700 | $105,700 |
| 2017 | $3,225 | $148,400 | $42,700 | $105,700 |
| 2016 | $3,123 | $143,200 | $42,700 | $100,500 |
| 2015 | $3,253 | $144,500 | $41,400 | $103,100 |
| 2014 | $2,967 | $144,500 | $41,400 | $103,100 |
Source: Public Records
Map
Nearby Homes
Your Personal Tour Guide
Ask me questions while you tour the home.