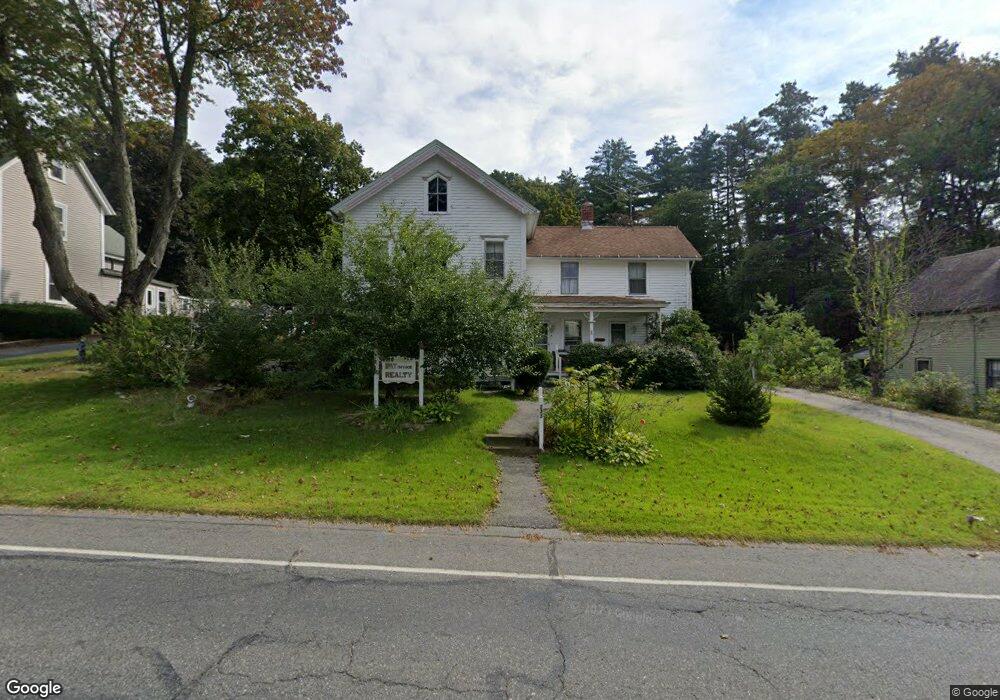
233 Maple St Warren, MA 01083
Estimated Value: $411,502
5
Beds
2
Baths
2,252
Sq Ft
$183/Sq Ft
Est. Value
About This Home
This home is located at 233 Maple St, Warren, MA 01083 and is currently priced at $411,502, approximately $182 per square foot. 233 Maple St is a home located in Worcester County with nearby schools including Quaboag Regional High School.
Ownership History
Date
Name
Owned For
Owner Type
Purchase Details
Closed on
May 12, 2024
Sold by
Bourbonnais Steven
Bought by
Bourbonnais Mark and Burnham Patricia A
Current Estimated Value
Purchase Details
Closed on
Jan 7, 2023
Sold by
Burnham Patricia A
Bought by
Burnham Patricia A and Bourbonnais Steven
Purchase Details
Closed on
Mar 29, 1973
Bought by
Burnham Patricia A
Create a Home Valuation Report for This Property
The Home Valuation Report is an in-depth analysis detailing your home's value as well as a comparison with similar homes in the area
Home Values in the Area
Average Home Value in this Area
Purchase History
| Date | Buyer | Sale Price | Title Company |
|---|---|---|---|
| Bourbonnais Mark | -- | None Available | |
| Bourbonnais Mark | -- | None Available | |
| Burnham Patricia A | -- | None Available | |
| Burnham Patricia A | -- | None Available | |
| Burnham Patricia A | -- | -- |
Source: Public Records
Mortgage History
| Date | Status | Borrower | Loan Amount |
|---|---|---|---|
| Previous Owner | Burnham Patricia A | $10,000 |
Source: Public Records
Map
Nearby Homes
- 59 High St
- Lot 5 Brimfield Rd
- Lot 3 Brimfield Rd
- 83 Comins Pond Rd
- 36 Nelson St
- Lot 7 Reed St
- Lot 4 Brimfield Rd
- Lot 8 Southbridge Rd
- LOT 7 Southbridge Rd
- 366 Southbridge Rd
- 111 Quaboag St
- 17 Otis St
- 8 Otis St
- 352 Reed St
- 0 Town Farm Rd
- Lot 3C Crouch Rd
- 95 Town Farm Rd
- 235 Crouch Rd
- Lot 2 Brimfield Rd
- Lot 1 Brimfield Rd
Your Personal Tour Guide
Ask me questions while you tour the home.