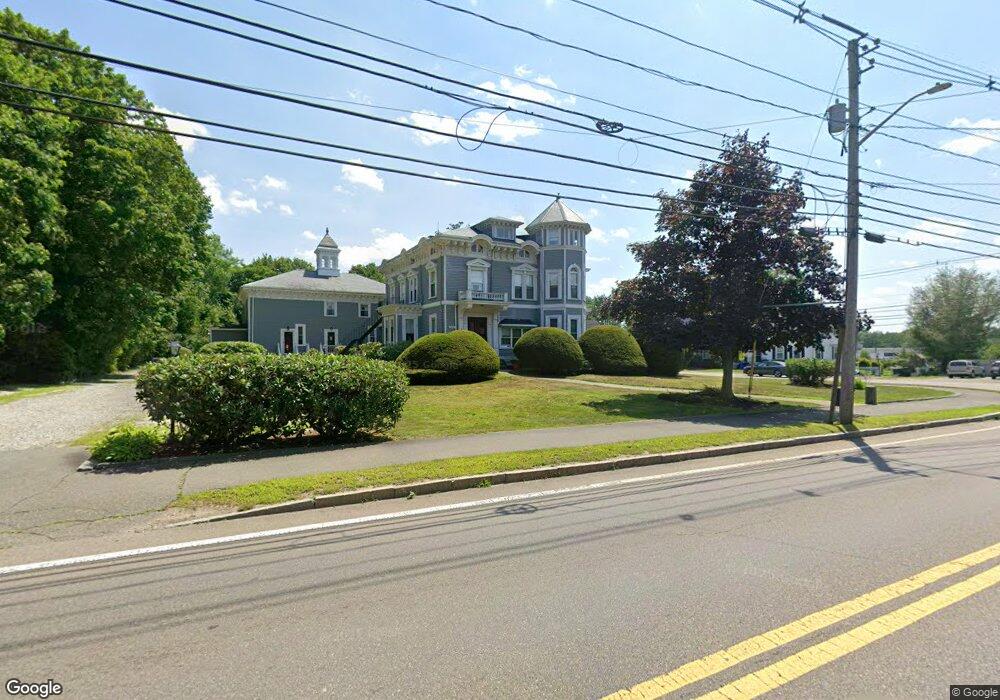
233 Market St Unit 4 Rockland, MA 02370
Estimated Value: $314,000 - $357,455
2
Beds
1
Bath
1,132
Sq Ft
$304/Sq Ft
Est. Value
About This Home
This home is located at 233 Market St Unit 4, Rockland, MA 02370 and is currently estimated at $344,614, approximately $304 per square foot. 233 Market St Unit 4 is a home located in Plymouth County with nearby schools including Rockland Senior High School, Calvary Chapel Academy, and Holy Family Elementary School.
Ownership History
Date
Name
Owned For
Owner Type
Purchase Details
Closed on
Mar 21, 2019
Sold by
Ashland Elizabeth A
Bought by
233 Market St T
Current Estimated Value
Purchase Details
Closed on
Jun 28, 1996
Sold by
Scarpelli William B and Foy Jeanne A
Bought by
Ashland Elizabeth A
Purchase Details
Closed on
Apr 30, 1992
Sold by
Perry Estate Rt
Bought by
Scarpelli Wm B and Foy Jeanne A
Create a Home Valuation Report for This Property
The Home Valuation Report is an in-depth analysis detailing your home's value as well as a comparison with similar homes in the area
Home Values in the Area
Average Home Value in this Area
Purchase History
| Date | Buyer | Sale Price | Title Company |
|---|---|---|---|
| 233 Market St T | -- | -- | |
| Ashland Elizabeth A | $95,000 | -- | |
| Scarpelli Wm B | $80,000 | -- |
Source: Public Records
Mortgage History
| Date | Status | Borrower | Loan Amount |
|---|---|---|---|
| Previous Owner | Scarpelli Wm B | $104,000 | |
| Previous Owner | Scarpelli Wm B | $114,000 | |
| Previous Owner | Scarpelli Wm B | $100,000 |
Source: Public Records
Tax History Compared to Growth
Tax History
| Year | Tax Paid | Tax Assessment Tax Assessment Total Assessment is a certain percentage of the fair market value that is determined by local assessors to be the total taxable value of land and additions on the property. | Land | Improvement |
|---|---|---|---|---|
| 2025 | $4,463 | $326,500 | $0 | $326,500 |
| 2024 | $4,374 | $311,100 | $0 | $311,100 |
| 2023 | $4,275 | $280,900 | $0 | $280,900 |
| 2022 | $4,062 | $242,500 | $0 | $242,500 |
| 2021 | $3,919 | $226,800 | $0 | $226,800 |
| 2020 | $3,896 | $222,600 | $0 | $222,600 |
| 2019 | $3,769 | $210,300 | $0 | $210,300 |
| 2018 | $3,363 | $184,600 | $0 | $184,600 |
| 2017 | $3,288 | $177,900 | $0 | $177,900 |
| 2016 | $3,164 | $171,100 | $0 | $171,100 |
| 2015 | $3,132 | $164,600 | $0 | $164,600 |
| 2014 | $2,676 | $145,900 | $0 | $145,900 |
Source: Public Records
Map
Nearby Homes
- 94-96 Crescent St
- 133 Crescent St
- 149 Concord St
- 140 W Water St
- 440 Market St
- 92 Liberty St
- 133 Spring St
- 49 Liberty St
- 50 Linden Park
- 225 W Water St
- 9 Old Market St
- 103 Grove St Unit 337
- 119 Grove St Unit 238
- 119 Grove St Unit 223
- 135 Grove St Unit 110
- 38 Levin Rd
- 45-47 Park St
- 20 Pat Rose Way
- 19 Pat Rose Way
- 6 Pat Rose Way
- 233 Market St Unit 7
- 233 Market St Unit 6
- 233 Market St Unit 5
- 233 Market St Unit 3
- 233 Market St Unit 2
- 233 Market St Unit 3 233
- 233 Market St Unit 1,1
- 247 Market St
- 13 Concord St
- 244 Market St
- 215 Market St
- 19 Concord St
- 255 Market St
- 27 Concord St
- 230 Market St
- 35 Concord St
- 44 Concord St
- 260 Market St
- 261 Market St
- 41 Concord St