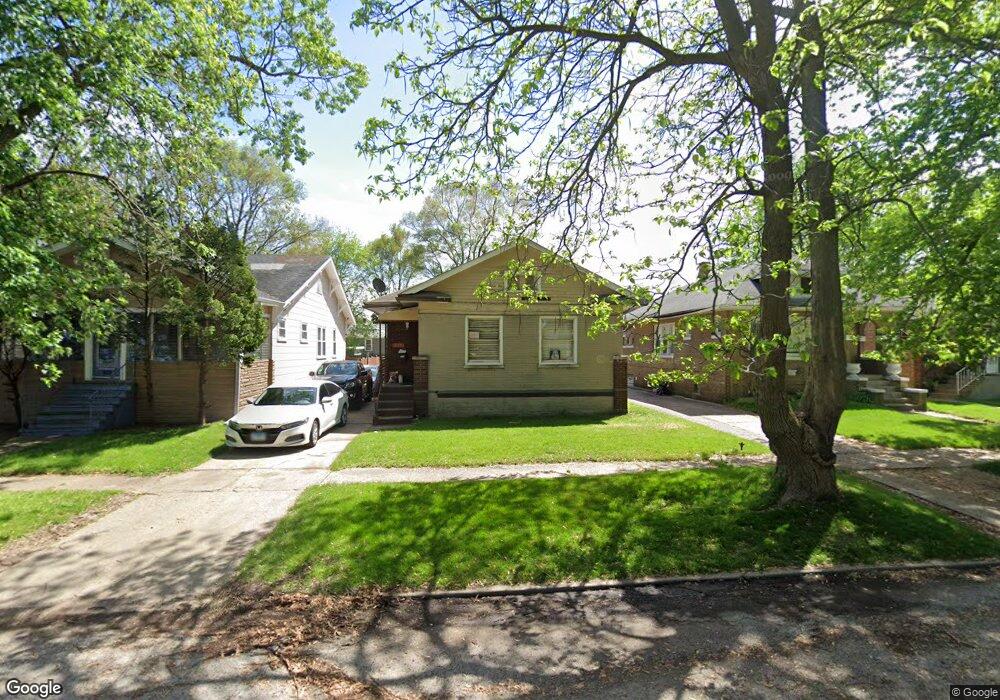
233 Mason St Calumet City, IL 60409
Estimated Value: $154,424 - $204,000
3
Beds
2
Baths
1,000
Sq Ft
$173/Sq Ft
Est. Value
About This Home
This home is located at 233 Mason St, Calumet City, IL 60409 and is currently estimated at $173,106, approximately $173 per square foot. 233 Mason St is a home located in Cook County with nearby schools including Lincoln Elementary School, Thornton Fractional North High School, and Hammond Academy Of Science & Tech.
Ownership History
Date
Name
Owned For
Owner Type
Purchase Details
Closed on
Jun 8, 2011
Sold by
Secretary Of Housing & Urban Development
Bought by
Chavez Beethoven
Current Estimated Value
Purchase Details
Closed on
Oct 1, 2009
Sold by
Jackson Steven
Bought by
The Secretary Of Housing & Urban Develop
Purchase Details
Closed on
Dec 31, 1999
Sold by
South Holland Trust & Svgs Bank
Bought by
Jackson Steven
Home Financials for this Owner
Home Financials are based on the most recent Mortgage that was taken out on this home.
Original Mortgage
$79,750
Interest Rate
8.18%
Mortgage Type
FHA
Create a Home Valuation Report for This Property
The Home Valuation Report is an in-depth analysis detailing your home's value as well as a comparison with similar homes in the area
Home Values in the Area
Average Home Value in this Area
Purchase History
| Date | Buyer | Sale Price | Title Company |
|---|---|---|---|
| Chavez Beethoven | -- | Stewart Title Company | |
| The Secretary Of Housing & Urban Develop | -- | None Available | |
| Jackson Steven | $80,000 | -- |
Source: Public Records
Mortgage History
| Date | Status | Borrower | Loan Amount |
|---|---|---|---|
| Previous Owner | Jackson Steven | $79,750 |
Source: Public Records
Tax History Compared to Growth
Tax History
| Year | Tax Paid | Tax Assessment Tax Assessment Total Assessment is a certain percentage of the fair market value that is determined by local assessors to be the total taxable value of land and additions on the property. | Land | Improvement |
|---|---|---|---|---|
| 2024 | $3,421 | $9,500 | $1,872 | $7,628 |
| 2023 | $2,434 | $9,500 | $1,872 | $7,628 |
| 2022 | $2,434 | $6,783 | $1,638 | $5,145 |
| 2021 | $2,551 | $6,783 | $1,638 | $5,145 |
| 2020 | $2,536 | $6,783 | $1,638 | $5,145 |
| 2019 | $2,311 | $6,626 | $1,521 | $5,105 |
| 2018 | $2,274 | $6,626 | $1,521 | $5,105 |
| 2017 | $2,232 | $6,626 | $1,521 | $5,105 |
| 2016 | $2,552 | $6,443 | $1,404 | $5,039 |
| 2015 | $2,384 | $6,443 | $1,404 | $5,039 |
| 2014 | $1,029 | $1,907 | $1,404 | $503 |
| 2013 | $1,003 | $2,034 | $1,404 | $630 |
Source: Public Records
Map
Nearby Homes