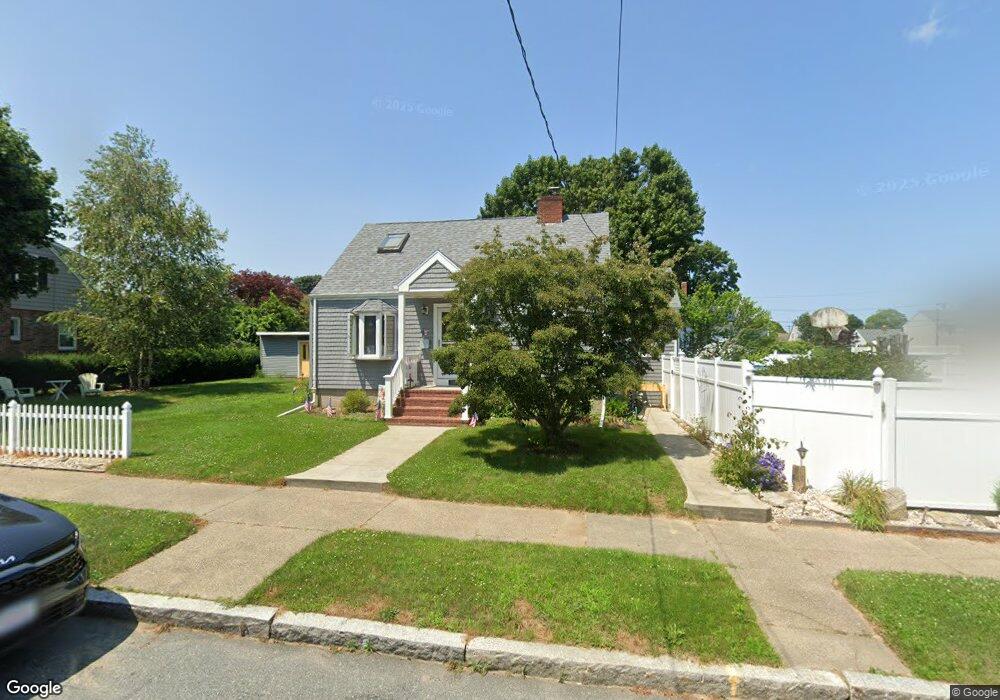
233 Matthew St New Bedford, MA 02740
The South End NeighborhoodEstimated Value: $411,000 - $447,000
3
Beds
1
Bath
1,050
Sq Ft
$408/Sq Ft
Est. Value
About This Home
This home is located at 233 Matthew St, New Bedford, MA 02740 and is currently estimated at $428,524, approximately $408 per square foot. 233 Matthew St is a home located in Bristol County with nearby schools including Betsey B. Winslow Elementary School, Keith Middle School, and New Bedford High School.
Ownership History
Date
Name
Owned For
Owner Type
Purchase Details
Closed on
Apr 13, 2023
Sold by
Norton Stephen M and Norton Catherine D
Bought by
Norton Ft and Norton
Current Estimated Value
Create a Home Valuation Report for This Property
The Home Valuation Report is an in-depth analysis detailing your home's value as well as a comparison with similar homes in the area
Home Values in the Area
Average Home Value in this Area
Purchase History
| Date | Buyer | Sale Price | Title Company |
|---|---|---|---|
| Norton Ft | -- | None Available | |
| Norton Ft | -- | None Available |
Source: Public Records
Tax History Compared to Growth
Tax History
| Year | Tax Paid | Tax Assessment Tax Assessment Total Assessment is a certain percentage of the fair market value that is determined by local assessors to be the total taxable value of land and additions on the property. | Land | Improvement |
|---|---|---|---|---|
| 2025 | $4,282 | $378,600 | $127,900 | $250,700 |
| 2024 | $3,899 | $324,900 | $130,100 | $194,800 |
| 2023 | $4,184 | $292,800 | $112,100 | $180,700 |
| 2022 | $3,871 | $249,100 | $106,600 | $142,500 |
| 2021 | $3,799 | $243,700 | $106,600 | $137,100 |
| 2020 | $3,670 | $227,100 | $106,600 | $120,500 |
| 2019 | $2,146 | $215,700 | $106,600 | $109,100 |
| 2018 | $3,710 | $202,100 | $106,600 | $95,500 |
| 2017 | $1,703 | $192,200 | $106,600 | $85,600 |
| 2016 | $3,082 | $186,900 | $106,600 | $80,300 |
| 2015 | $2,885 | $183,400 | $106,600 | $76,800 |
| 2014 | $2,658 | $175,300 | $100,200 | $75,100 |
Source: Public Records
Map
Nearby Homes