Estimated Value: $452,000 - $517,000
--
Bed
--
Bath
1,317
Sq Ft
$367/Sq Ft
Est. Value
About This Home
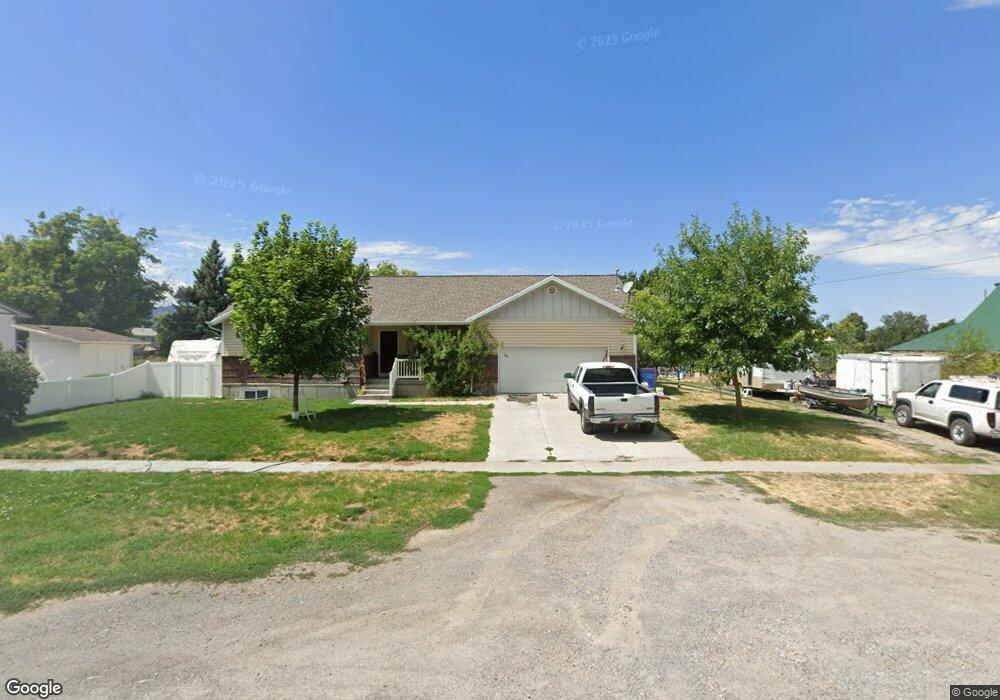
This home is located at 233 N 400 W, Hyrum, UT 84319 and is currently estimated at $482,804, approximately $366 per square foot. 233 N 400 W is a home with nearby schools including Lincoln School, South Cache Middle School, and Mountain Crest High School.
Ownership History
Date
Name
Owned For
Owner Type
Purchase Details
Closed on
Jun 10, 2013
Sold by
Miller Carson N and Fenton Keirshia T
Bought by
Miller Carson N and Miller Keirshia T
Current Estimated Value
Home Financials for this Owner
Home Financials are based on the most recent Mortgage that was taken out on this home.
Original Mortgage
$159,000
Interest Rate
3.37%
Mortgage Type
New Conventional
Purchase Details
Closed on
Oct 20, 2011
Sold by
Miller Josh and Miller Heidi
Bought by
Miller Carson N and Fenton Keirshia T
Purchase Details
Closed on
Mar 15, 2006
Sold by
Miller Richard L
Bought by
Miller Josh and Miller Heidi
Create a Home Valuation Report for This Property
The Home Valuation Report is an in-depth analysis detailing your home's value as well as a comparison with similar homes in the area
Home Values in the Area
Average Home Value in this Area
Purchase History
| Date | Buyer | Sale Price | Title Company |
|---|---|---|---|
| Miller Carson N | -- | Cache Title Logan | |
| Miller Carson N | -- | Cache Title Company | |
| Miller Josh | -- | Accommodation |
Source: Public Records
Mortgage History
| Date | Status | Borrower | Loan Amount |
|---|---|---|---|
| Closed | Miller Carson N | $159,000 |
Source: Public Records
Tax History Compared to Growth
Tax History
| Year | Tax Paid | Tax Assessment Tax Assessment Total Assessment is a certain percentage of the fair market value that is determined by local assessors to be the total taxable value of land and additions on the property. | Land | Improvement |
|---|---|---|---|---|
| 2025 | $1,818 | $261,025 | $0 | $0 |
| 2024 | $1,951 | $261,535 | $0 | $0 |
| 2023 | $2,072 | $265,635 | $0 | $0 |
| 2022 | $2,162 | $265,635 | $0 | $0 |
| 2021 | $1,727 | $326,849 | $70,570 | $256,279 |
| 2020 | $1,652 | $293,422 | $70,570 | $222,852 |
| 2019 | $1,629 | $272,162 | $49,310 | $222,852 |
| 2018 | $1,537 | $248,285 | $49,310 | $198,975 |
| 2017 | $1,567 | $131,345 | $0 | $0 |
| 2016 | $1,603 | $110,005 | $0 | $0 |
| 2015 | $1,346 | $110,005 | $0 | $0 |
| 2014 | $1,314 | $109,840 | $0 | $0 |
| 2013 | -- | $109,840 | $0 | $0 |
Source: Public Records
Map
Nearby Homes