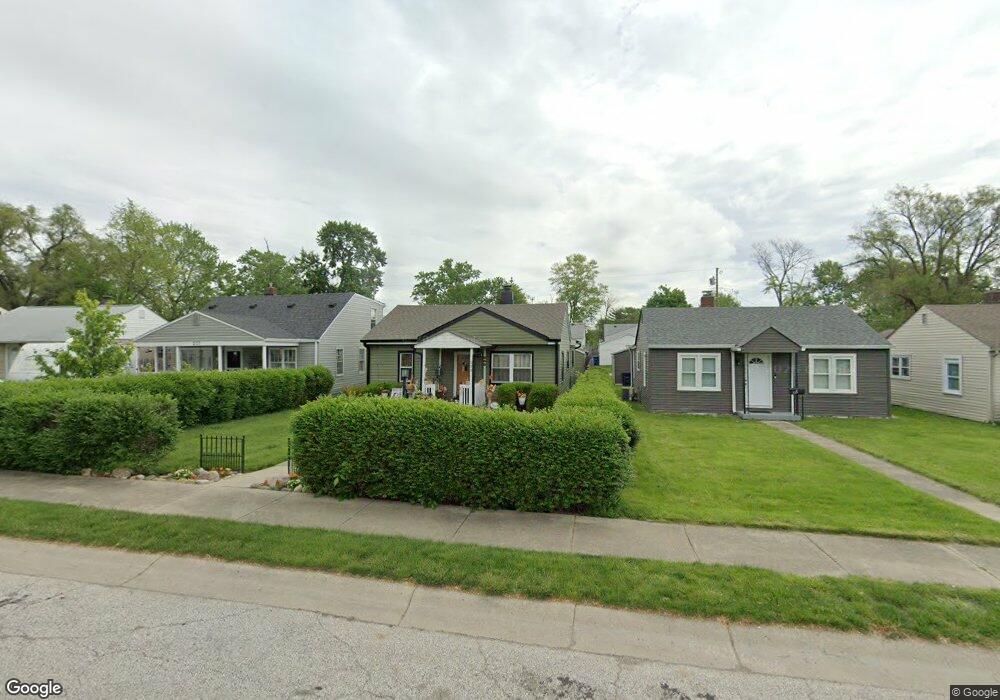
233 N 7th Ave Beech Grove, IN 46107
Estimated Value: $147,000 - $159,000
2
Beds
1
Bath
868
Sq Ft
$176/Sq Ft
Est. Value
About This Home
This home is located at 233 N 7th Ave, Beech Grove, IN 46107 and is currently estimated at $153,156, approximately $176 per square foot. 233 N 7th Ave is a home located in Marion County with nearby schools including Hornet Park Elementary School, Central Elementary School, and South Grove Intermediate School.
Ownership History
Date
Name
Owned For
Owner Type
Purchase Details
Closed on
Jun 11, 2020
Sold by
Dapper Robert L
Bought by
Wilhelm Paula E
Current Estimated Value
Home Financials for this Owner
Home Financials are based on the most recent Mortgage that was taken out on this home.
Original Mortgage
$98,526
Outstanding Balance
$86,169
Interest Rate
3.2%
Mortgage Type
New Conventional
Estimated Equity
$66,987
Purchase Details
Closed on
Sep 29, 2010
Sold by
Saveley John and Estate Of Donna Mary Bates
Bought by
Dapper Robert L
Create a Home Valuation Report for This Property
The Home Valuation Report is an in-depth analysis detailing your home's value as well as a comparison with similar homes in the area
Home Values in the Area
Average Home Value in this Area
Purchase History
| Date | Buyer | Sale Price | Title Company |
|---|---|---|---|
| Wilhelm Paula E | -- | None Available | |
| Dapper Robert L | -- | None Available |
Source: Public Records
Mortgage History
| Date | Status | Borrower | Loan Amount |
|---|---|---|---|
| Open | Wilhelm Paula E | $98,526 |
Source: Public Records
Tax History
| Year | Tax Paid | Tax Assessment Tax Assessment Total Assessment is a certain percentage of the fair market value that is determined by local assessors to be the total taxable value of land and additions on the property. | Land | Improvement |
|---|---|---|---|---|
| 2025 | $1,142 | $92,500 | $18,000 | $74,500 |
| 2024 | $1,158 | $93,000 | $18,000 | $75,000 |
| 2023 | $1,158 | $94,000 | $18,000 | $76,000 |
| 2022 | $1,134 | $85,200 | $18,000 | $67,200 |
| 2021 | $898 | $77,400 | $18,000 | $59,400 |
| 2020 | $692 | $69,300 | $18,000 | $51,300 |
| 2019 | $1,492 | $59,500 | $10,800 | $48,700 |
| 2018 | $1,341 | $55,400 | $10,800 | $44,600 |
| 2017 | $1,329 | $53,100 | $10,800 | $42,300 |
| 2016 | $1,273 | $51,400 | $10,800 | $40,600 |
| 2014 | $1,110 | $49,100 | $10,800 | $38,300 |
| 2013 | $1,110 | $49,100 | $10,800 | $38,300 |
Source: Public Records
Map
Nearby Homes
- 237 N 8th Ave
- 243 N 5th Ave
- 219 N 9th Ave
- 100 N 6th Ave
- 137 N 4th Ave
- 61 N 8th Ave
- 65 S 8th Ave
- 1005 Main St
- 83 S 8th Ave
- 106 S 3rd Ave
- 112 S 3rd Ave
- 1510 Churchman Ave
- 116 S 3rd Ave
- 122 S 3rd Ave
- 2021 Prospect St
- 1639 E Southern Ave
- 154 S 4th Ave
- 1115 Bethel Ave
- 3236 S Emerson Ave
- 847 Churchman Ave
Your Personal Tour Guide
Ask me questions while you tour the home.