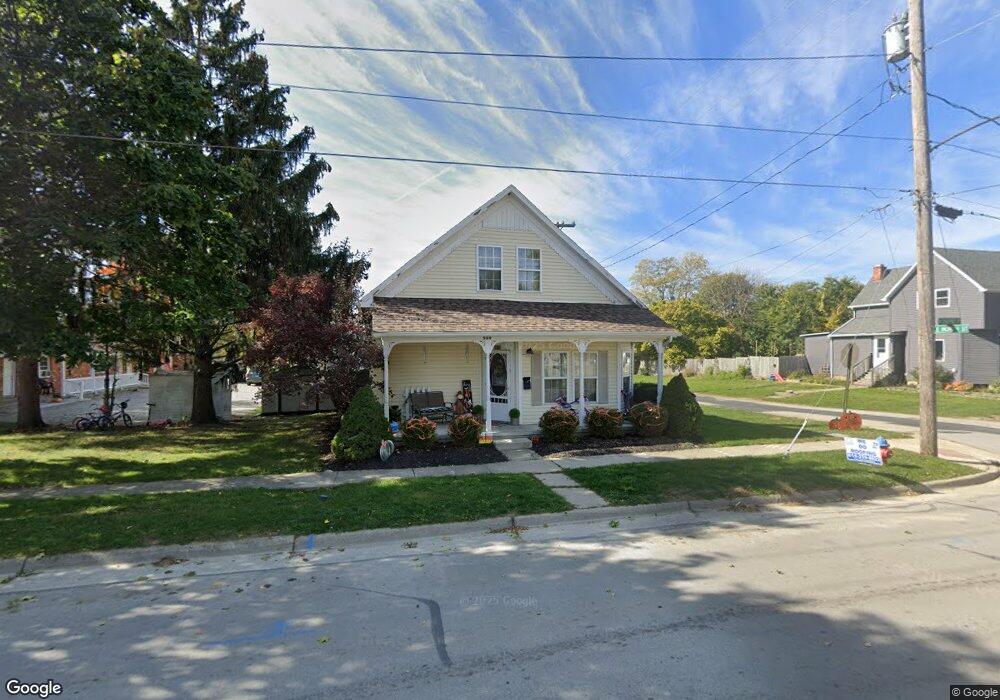
233 N Chestnut St Saint Marys, OH 45885
Estimated Value: $91,000 - $165,000
2
Beds
2
Baths
1,675
Sq Ft
$76/Sq Ft
Est. Value
About This Home
This home is located at 233 N Chestnut St, Saint Marys, OH 45885 and is currently estimated at $127,473, approximately $76 per square foot. 233 N Chestnut St is a home located in Auglaize County with nearby schools including St. Mary's East Primary School, St. Mary's West Intermediate School, and St. Marys Middle School.
Ownership History
Date
Name
Owned For
Owner Type
Purchase Details
Closed on
Nov 23, 2020
Sold by
Henning Terry W and Henning Brenda A
Bought by
Speckman Randy and Speckman Margaret
Current Estimated Value
Purchase Details
Closed on
Apr 21, 2012
Sold by
Weber Justin J and Weber Lauren Elizabeth
Bought by
Henning Terry W and Henning Brenda A
Home Financials for this Owner
Home Financials are based on the most recent Mortgage that was taken out on this home.
Original Mortgage
$48,000
Outstanding Balance
$33,419
Interest Rate
4.08%
Mortgage Type
New Conventional
Estimated Equity
$94,054
Purchase Details
Closed on
Mar 26, 2007
Sold by
Koenig Dustin and Koenig Nicole
Bought by
Weber Justin J
Home Financials for this Owner
Home Financials are based on the most recent Mortgage that was taken out on this home.
Original Mortgage
$61,600
Interest Rate
6.25%
Mortgage Type
Purchase Money Mortgage
Purchase Details
Closed on
Nov 26, 2001
Sold by
Davis James D
Bought by
Bussey Nicole
Purchase Details
Closed on
Dec 28, 1995
Sold by
Freewalt Edna V
Bought by
Davis James D
Create a Home Valuation Report for This Property
The Home Valuation Report is an in-depth analysis detailing your home's value as well as a comparison with similar homes in the area
Home Values in the Area
Average Home Value in this Area
Purchase History
| Date | Buyer | Sale Price | Title Company |
|---|---|---|---|
| Speckman Randy | $50,000 | None Available | |
| Henning Terry W | $60,000 | Attorney | |
| Weber Justin J | $77,000 | Attorney | |
| Bussey Nicole | $68,000 | -- | |
| Davis James D | $25,000 | -- |
Source: Public Records
Mortgage History
| Date | Status | Borrower | Loan Amount |
|---|---|---|---|
| Open | Henning Terry W | $48,000 | |
| Closed | Weber Justin J | $61,600 |
Source: Public Records
Tax History Compared to Growth
Tax History
| Year | Tax Paid | Tax Assessment Tax Assessment Total Assessment is a certain percentage of the fair market value that is determined by local assessors to be the total taxable value of land and additions on the property. | Land | Improvement |
|---|---|---|---|---|
| 2024 | $1,915 | $26,950 | $5,120 | $21,830 |
| 2023 | $1,031 | $26,950 | $5,120 | $21,830 |
| 2022 | $1,033 | $23,960 | $4,640 | $19,320 |
| 2021 | $1,014 | $23,960 | $4,640 | $19,320 |
| 2020 | $518 | $23,962 | $4,638 | $19,324 |
| 2019 | $869 | $19,769 | $3,819 | $15,950 |
| 2018 | $869 | $19,769 | $3,819 | $15,950 |
| 2017 | $871 | $19,769 | $3,819 | $15,950 |
| 2016 | $837 | $19,597 | $3,525 | $16,072 |
| 2015 | $819 | $19,597 | $3,525 | $16,072 |
| 2014 | $825 | $19,597 | $3,525 | $16,072 |
| 2013 | $853 | $19,597 | $3,525 | $16,072 |
Source: Public Records
Map
Nearby Homes
- 134 N Front St
- 405 E Spring St
- 712 Columbia St
- 428 W Spring St
- 520 Oil St
- 125 Beech St
- 602 Weston St
- 811 Columbia St
- 403 S Vine St
- 105 Maple St
- 216 Beech St
- 706 Jackson St
- 408 S Vine St
- 911 Cleveland Ave
- 332 Miami Erie Cir
- 324 Miami Erie Cir
- 902 Tecumseh Dr
- 345 Miami Erie Cir
- 308 Miami Erie Cir
- 316 Miami Erie Cir
- 301 N Chestnut St
- 215 N Chestnut St
- 307 N Chestnut St
- 230 N Chestnut St
- 224 N Chestnut St
- 220 N Chestnut St
- 302 N Chestnut St
- 211 N Chestnut St
- 311 N Chestnut St
- 308 N Chestnut St
- 318 N Chestnut St
- 324 N Chestnut St
- 231 N Walnut St
- 212 E High St
- 227 N Walnut St
- 223 N Walnut St
- 326 N Chestnut St
- 211 N Walnut St