233 N Main St Brigham City, UT 84302
Estimated Value: $349,000 - $394,000
4
Beds
2
Baths
1,145
Sq Ft
$317/Sq Ft
Est. Value
About This Home
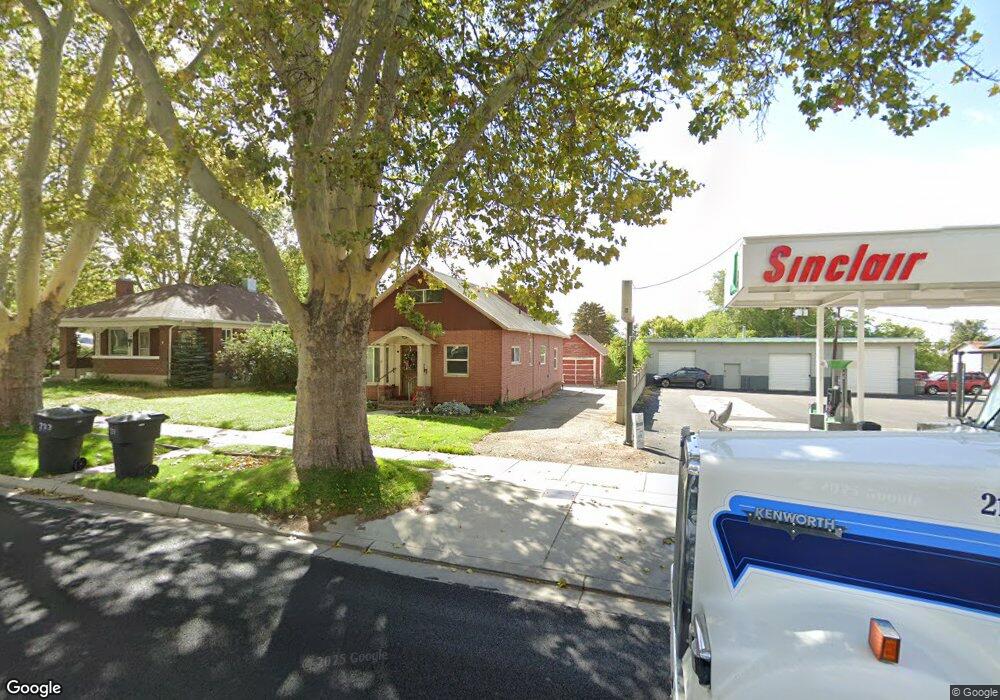
This home is located at 233 N Main St, Brigham City, UT 84302 and is currently estimated at $362,869, approximately $316 per square foot. 233 N Main St is a home located in Box Elder County with nearby schools including Discovery School, Box Elder Middle School, and Adele C. Young Intermediate School.
Ownership History
Date
Name
Owned For
Owner Type
Purchase Details
Closed on
Mar 17, 2015
Sold by
Johnson Gregry S
Bought by
Bank Of Utah
Current Estimated Value
Purchase Details
Closed on
Oct 25, 2010
Sold by
Benjamin Steven
Bought by
Lewis Jason and Lewis Nicole
Home Financials for this Owner
Home Financials are based on the most recent Mortgage that was taken out on this home.
Original Mortgage
$111,902
Interest Rate
4.93%
Mortgage Type
Unknown
Purchase Details
Closed on
Dec 15, 2006
Sold by
Freeman Richard C
Bought by
Benjamin Steven
Create a Home Valuation Report for This Property
The Home Valuation Report is an in-depth analysis detailing your home's value as well as a comparison with similar homes in the area
Home Values in the Area
Average Home Value in this Area
Purchase History
| Date | Buyer | Sale Price | Title Company |
|---|---|---|---|
| Bank Of Utah | -- | None Available | |
| Lewis Jason | -- | Millcreek Land Title | |
| Benjamin Steven | -- | None Available |
Source: Public Records
Mortgage History
| Date | Status | Borrower | Loan Amount |
|---|---|---|---|
| Previous Owner | Lewis Jason | $111,902 |
Source: Public Records
Tax History Compared to Growth
Tax History
| Year | Tax Paid | Tax Assessment Tax Assessment Total Assessment is a certain percentage of the fair market value that is determined by local assessors to be the total taxable value of land and additions on the property. | Land | Improvement |
|---|---|---|---|---|
| 2025 | $1,947 | $334,895 | $105,000 | $229,895 |
| 2024 | $1,707 | $328,551 | $100,000 | $228,551 |
| 2023 | $1,774 | $349,771 | $95,000 | $254,771 |
| 2022 | $1,731 | $317,257 | $40,000 | $277,257 |
| 2021 | $1,356 | $194,993 | $40,000 | $154,993 |
| 2020 | $1,200 | $194,993 | $40,000 | $154,993 |
| 2019 | $1,127 | $97,439 | $22,000 | $75,439 |
| 2018 | $1,019 | $87,599 | $22,000 | $65,599 |
| 2017 | $869 | $129,299 | $16,500 | $99,299 |
| 2016 | $910 | $68,514 | $16,500 | $52,014 |
| 2015 | $849 | $63,785 | $16,500 | $47,285 |
| 2014 | $849 | $61,533 | $16,500 | $45,033 |
| 2013 | -- | $61,533 | $16,500 | $45,033 |
Source: Public Records
Map
Nearby Homes