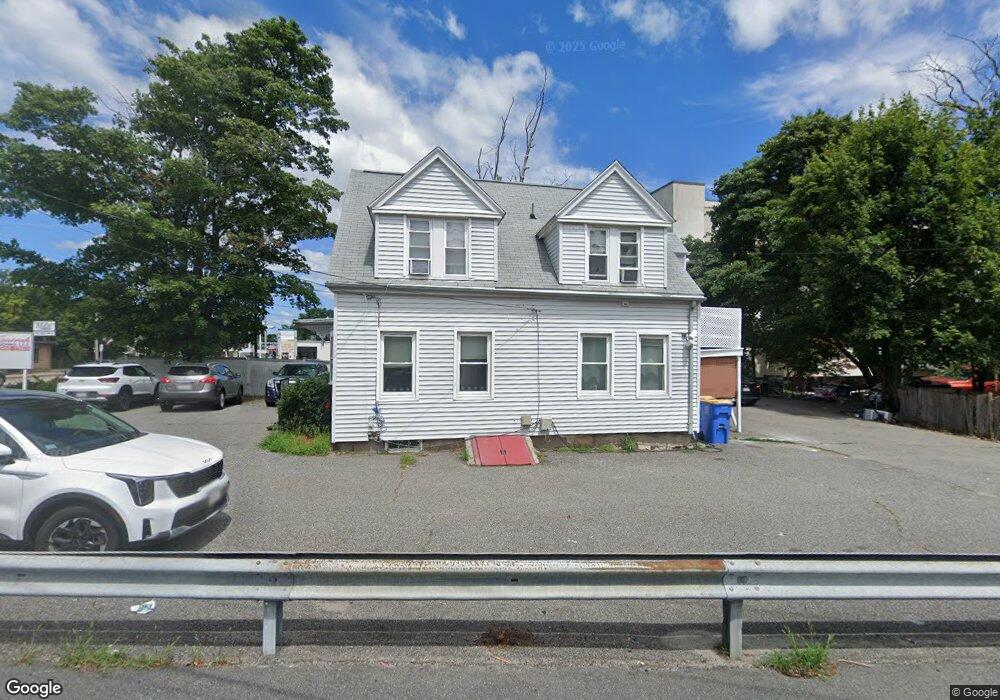
233 N Main St Randolph, MA 02368
Downtown Randolph NeighborhoodEstimated Value: $573,698
1
Bed
2
Baths
1,893
Sq Ft
$303/Sq Ft
Est. Value
About This Home
This home is located at 233 N Main St, Randolph, MA 02368 and is currently estimated at $573,698, approximately $303 per square foot. 233 N Main St is a home located in Norfolk County with nearby schools including Randolph High School, Boston Higashi School, and Lighthouse Baptist Christian Academy.
Ownership History
Date
Name
Owned For
Owner Type
Purchase Details
Closed on
Apr 26, 2018
Sold by
Charles A Powers & Sons
Bought by
Mopac Cmmc Property Ll
Current Estimated Value
Home Financials for this Owner
Home Financials are based on the most recent Mortgage that was taken out on this home.
Original Mortgage
$252,750
Outstanding Balance
$217,826
Interest Rate
4.44%
Mortgage Type
Commercial
Estimated Equity
$355,872
Purchase Details
Closed on
Mar 23, 2018
Sold by
Charles A Powers & Sons
Bought by
Brrd Llp
Home Financials for this Owner
Home Financials are based on the most recent Mortgage that was taken out on this home.
Original Mortgage
$252,750
Outstanding Balance
$217,826
Interest Rate
4.44%
Mortgage Type
Commercial
Estimated Equity
$355,872
Purchase Details
Closed on
Jun 2, 1983
Bought by
Powers Charles A and Powers Sons
Create a Home Valuation Report for This Property
The Home Valuation Report is an in-depth analysis detailing your home's value as well as a comparison with similar homes in the area
Home Values in the Area
Average Home Value in this Area
Purchase History
| Date | Buyer | Sale Price | Title Company |
|---|---|---|---|
| Mopac Cmmc Property Ll | $337,000 | -- | |
| Brrd Llp | -- | -- | |
| Powers Charles A | -- | -- |
Source: Public Records
Mortgage History
| Date | Status | Borrower | Loan Amount |
|---|---|---|---|
| Open | Mopac Cmmc Property Ll | $252,750 |
Source: Public Records
Tax History Compared to Growth
Tax History
| Year | Tax Paid | Tax Assessment Tax Assessment Total Assessment is a certain percentage of the fair market value that is determined by local assessors to be the total taxable value of land and additions on the property. | Land | Improvement |
|---|---|---|---|---|
| 2025 | -- | $569,100 | $406,500 | $162,600 |
| 2024 | -- | $554,600 | $398,500 | $156,100 |
| 2023 | $0 | $510,800 | $362,200 | $148,600 |
| 2022 | $0 | $450,400 | $301,800 | $148,600 |
| 2021 | $0 | $397,100 | $251,400 | $145,700 |
| 2020 | $0 | $391,300 | $251,400 | $139,900 |
| 2019 | $0 | $373,700 | $239,600 | $134,100 |
| 2018 | $0 | $318,100 | $217,800 | $100,300 |
| 2017 | $0 | $307,700 | $207,400 | $100,300 |
| 2016 | -- | $285,500 | $188,500 | $97,000 |
| 2015 | -- | $276,400 | $179,400 | $97,000 |
Source: Public Records
Map
Nearby Homes
- 12 Cottage St
- 47 West St Unit A2
- 17 Mill St
- 20 Nelson Dr Unit 3A
- 28 Silver St
- 73 Belcher St
- 46 Union Square Unit 46
- 54 Jasper Ln
- 18 Jasper Ln
- 30 Hemlock Terrace
- 12 Jasper Ln Unit 12
- 10 Alfred Terrace
- 159 Bittersweet Ln Unit 107
- 89 Fernandez Cir
- 59 Highland Glen Dr Unit 328
- 33 Liberty St
- 44 Liberty St
- 17 Mazzeo Dr
- 40 Linden Park Dr
- 217 Mill St