Estimated Value: $126,159 - $180,000
3
Beds
2
Baths
1,080
Sq Ft
$142/Sq Ft
Est. Value
About This Home
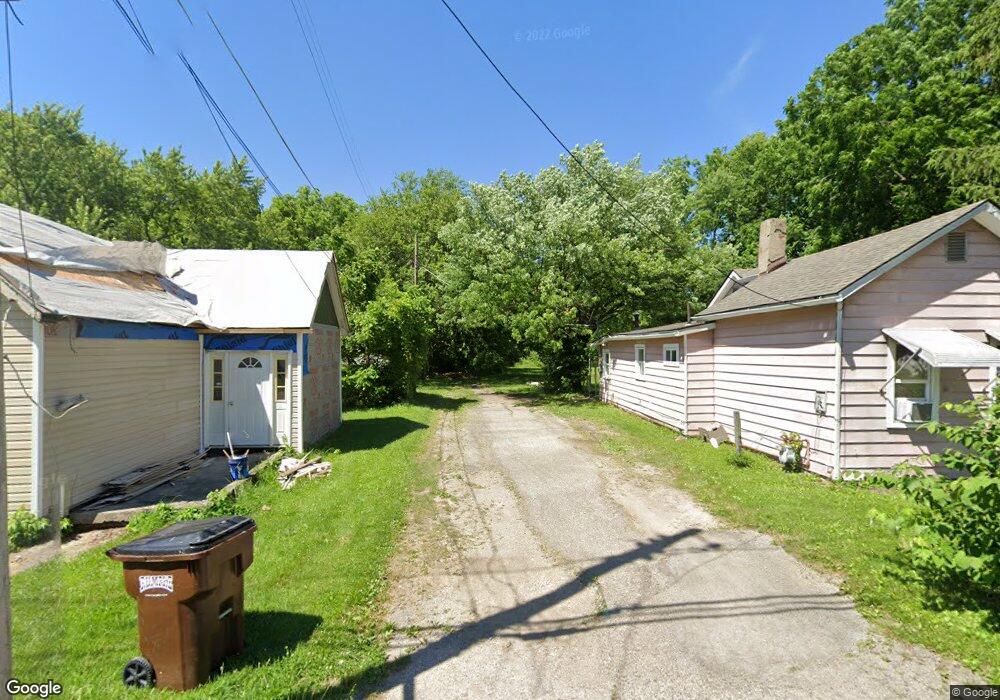
This home is located at 233 N West St, Xenia, OH 45385 and is currently estimated at $153,790, approximately $142 per square foot. 233 N West St is a home located in Greene County with nearby schools including Xenia High School, Summit Academy Community School for Alternative Learners - Xenia, and Legacy Christian Academy.
Ownership History
Date
Name
Owned For
Owner Type
Purchase Details
Closed on
Jul 31, 2023
Sold by
Ferguson Jeffrey J
Bought by
Robinson Lynn M
Current Estimated Value
Purchase Details
Closed on
Apr 26, 2018
Sold by
Pierson Esther and Pierson Philip E
Bought by
Pierson Esther
Purchase Details
Closed on
Apr 29, 2014
Sold by
Howell Alice M and Barber Alice H
Bought by
Pierson Philip E and Pierson Esther
Purchase Details
Closed on
Mar 16, 2007
Sold by
Barber Harry C
Bought by
Barbert Alice H
Purchase Details
Closed on
Oct 27, 2005
Sold by
Bennett Charlotte Yvonne
Bought by
Barber Harry C and Barber Alice H
Home Financials for this Owner
Home Financials are based on the most recent Mortgage that was taken out on this home.
Original Mortgage
$61,520
Interest Rate
5.89%
Mortgage Type
Fannie Mae Freddie Mac
Create a Home Valuation Report for This Property
The Home Valuation Report is an in-depth analysis detailing your home's value as well as a comparison with similar homes in the area
Home Values in the Area
Average Home Value in this Area
Purchase History
| Date | Buyer | Sale Price | Title Company |
|---|---|---|---|
| Robinson Lynn M | $80,000 | None Listed On Document | |
| Pierson Esther | -- | -- | |
| Pierson Philip E | $71,000 | None Available | |
| Barbert Alice H | -- | Attorney | |
| Barber Harry C | $76,900 | -- |
Source: Public Records
Mortgage History
| Date | Status | Borrower | Loan Amount |
|---|---|---|---|
| Previous Owner | Barber Harry C | $61,520 |
Source: Public Records
Tax History Compared to Growth
Tax History
| Year | Tax Paid | Tax Assessment Tax Assessment Total Assessment is a certain percentage of the fair market value that is determined by local assessors to be the total taxable value of land and additions on the property. | Land | Improvement |
|---|---|---|---|---|
| 2024 | $1,640 | $38,330 | $5,510 | $32,820 |
| 2023 | $1,640 | $38,330 | $5,510 | $32,820 |
| 2022 | $938 | $27,920 | $3,440 | $24,480 |
| 2021 | $950 | $27,920 | $3,440 | $24,480 |
| 2020 | $909 | $27,920 | $3,440 | $24,480 |
| 2019 | $726 | $23,160 | $4,250 | $18,910 |
| 2018 | $729 | $23,160 | $4,250 | $18,910 |
| 2017 | $708 | $23,160 | $4,250 | $18,910 |
| 2016 | $775 | $23,800 | $4,250 | $19,550 |
| 2015 | $1,263 | $23,800 | $4,250 | $19,550 |
| 2014 | $372 | $23,800 | $4,250 | $19,550 |
Source: Public Records
Map
Nearby Homes