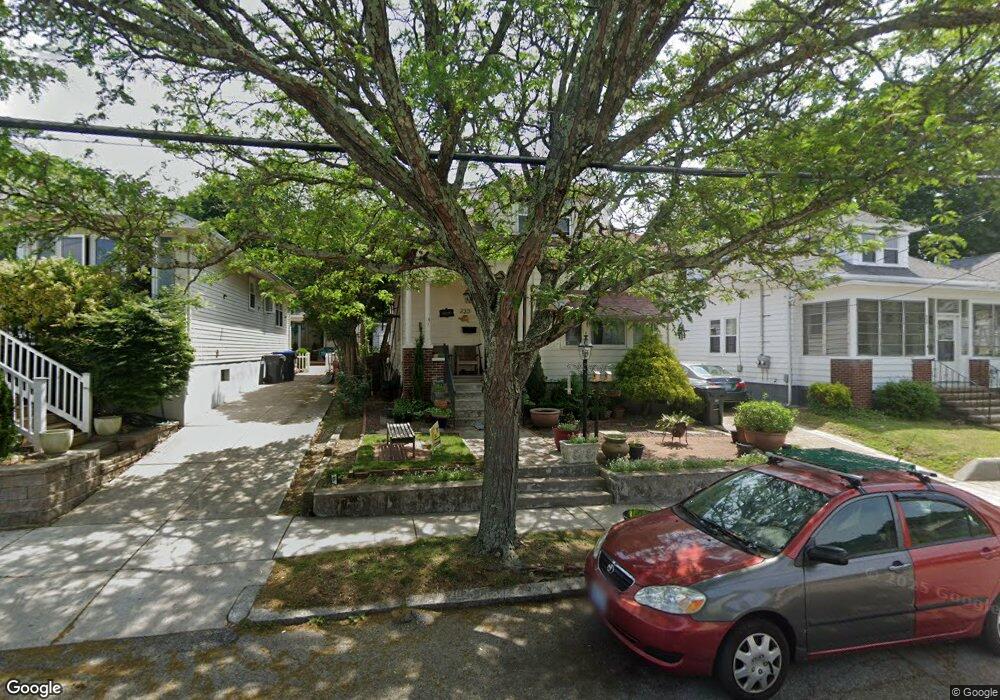
233 Nelson St Providence, RI 02908
Elmhurst NeighborhoodEstimated Value: $450,814 - $560,000
4
Beds
3
Baths
2,546
Sq Ft
$199/Sq Ft
Est. Value
About This Home
This home is located at 233 Nelson St, Providence, RI 02908 and is currently estimated at $507,454, approximately $199 per square foot. 233 Nelson St is a home located in Providence County with nearby schools including Asa Messer Elementary School, Charles N. Fortes Elementary School, and Veazie Street Elementary School.
Ownership History
Date
Name
Owned For
Owner Type
Purchase Details
Closed on
Oct 5, 2021
Sold by
Diaz Isabel C
Bought by
Diaz Isabel C and Diaz Karinah Y
Current Estimated Value
Home Financials for this Owner
Home Financials are based on the most recent Mortgage that was taken out on this home.
Original Mortgage
$230,000
Outstanding Balance
$208,826
Interest Rate
2.8%
Mortgage Type
New Conventional
Estimated Equity
$298,628
Purchase Details
Closed on
Jun 15, 2007
Sold by
Maccarone John C and Maccarone Ann M
Bought by
Diaz Isabel C
Home Financials for this Owner
Home Financials are based on the most recent Mortgage that was taken out on this home.
Original Mortgage
$225,750
Interest Rate
6.19%
Mortgage Type
Purchase Money Mortgage
Create a Home Valuation Report for This Property
The Home Valuation Report is an in-depth analysis detailing your home's value as well as a comparison with similar homes in the area
Home Values in the Area
Average Home Value in this Area
Purchase History
| Date | Buyer | Sale Price | Title Company |
|---|---|---|---|
| Diaz Isabel C | -- | None Available | |
| Diaz Isabel C | $262,500 | -- |
Source: Public Records
Mortgage History
| Date | Status | Borrower | Loan Amount |
|---|---|---|---|
| Open | Diaz Isabel C | $230,000 | |
| Previous Owner | Diaz Isabel C | $6,000 | |
| Previous Owner | Diaz Isabel C | $15,000 | |
| Previous Owner | Diaz Isabel C | $225,750 | |
| Previous Owner | Diaz Isabel C | $35,000 |
Source: Public Records
Tax History Compared to Growth
Tax History
| Year | Tax Paid | Tax Assessment Tax Assessment Total Assessment is a certain percentage of the fair market value that is determined by local assessors to be the total taxable value of land and additions on the property. | Land | Improvement |
|---|---|---|---|---|
| 2025 | $3,136 | $373,300 | $160,000 | $213,300 |
| 2024 | $5,079 | $276,800 | $104,000 | $172,800 |
| 2023 | $5,079 | $276,800 | $104,000 | $172,800 |
| 2022 | $4,927 | $276,800 | $104,000 | $172,800 |
| 2021 | $5,420 | $220,700 | $79,300 | $141,400 |
| 2020 | $5,420 | $220,700 | $79,300 | $141,400 |
| 2019 | $5,420 | $220,700 | $79,300 | $141,400 |
| 2018 | $4,858 | $152,000 | $63,800 | $88,200 |
| 2017 | $4,858 | $152,000 | $63,800 | $88,200 |
| 2016 | $4,858 | $152,000 | $63,800 | $88,200 |
| 2015 | $4,564 | $137,900 | $63,800 | $74,100 |
| 2014 | $4,654 | $137,900 | $63,800 | $74,100 |
| 2013 | $4,654 | $137,900 | $63,800 | $74,100 |
Source: Public Records
Map
Nearby Homes
- 299 Jastram St
- 268 Nelson St
- 210 Wardlaw Ave
- 616 River Ave
- 28 Mink Rd
- 797 Academy Ave
- 68 Enfield Ave
- 14 Ravenswood Ave
- 14 Stonelaw Ave
- 44 Elmcroft Ave
- 39 Hillview Ave
- 841 Smith St
- 117 Sharon St Unit 2
- 117 Sharon St
- 117 Sharon St Unit 1
- 1196 Smith St
- 493 Academy Ave
- 190 Enfield Ave
- 507 Sharon St
- 81 Gentian Ave