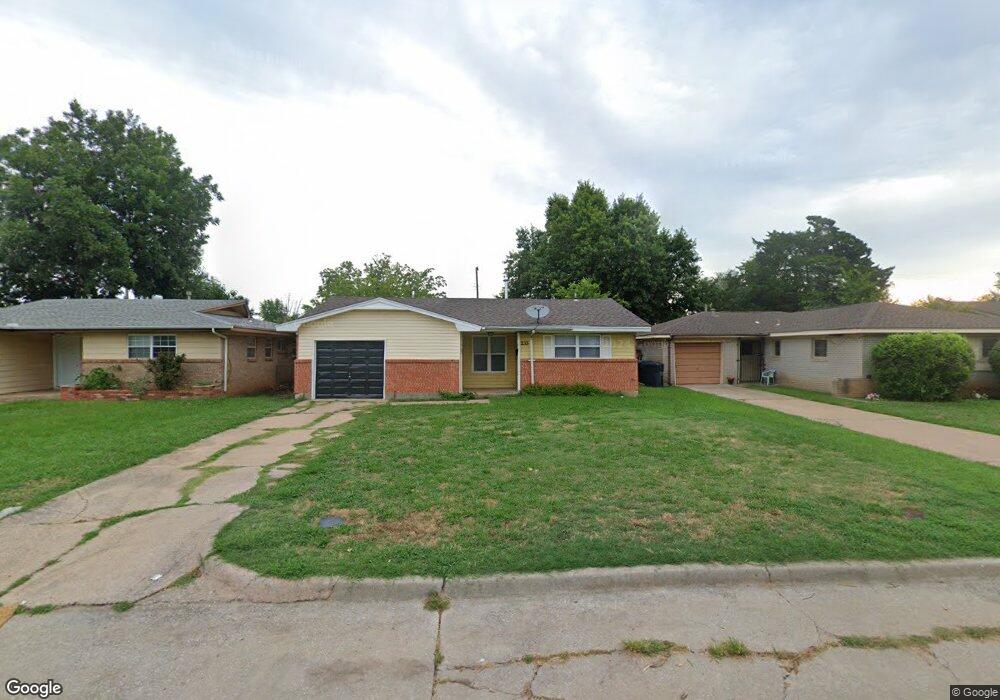
233 NW 82nd St Oklahoma City, OK 73114
North Highland NeighborhoodEstimated Value: $106,000 - $139,000
2
Beds
2
Baths
988
Sq Ft
$126/Sq Ft
Est. Value
About This Home
This home is located at 233 NW 82nd St, Oklahoma City, OK 73114 and is currently estimated at $124,445, approximately $125 per square foot. 233 NW 82nd St is a home located in Oklahoma County with nearby schools including Nichols Hills Enterprise Elementary School, John Marshall Enterprise Middle School, and John Marshall Enterprise High School.
Ownership History
Date
Name
Owned For
Owner Type
Purchase Details
Closed on
Dec 28, 2009
Sold by
Stone Breaker Enterprises Llc
Bought by
Peppa Properties Llc
Current Estimated Value
Purchase Details
Closed on
Jan 9, 2009
Sold by
Arch Bay Holdings Llc Series 2008B
Bought by
Stonebreaker Enterprises Llc
Purchase Details
Closed on
Jan 7, 2009
Sold by
Property Asset Management Inc
Bought by
Arch Bay Holdings Llc Series 2008B
Purchase Details
Closed on
Sep 16, 2008
Sold by
Jones Chad
Bought by
Property Asset Management Inc
Purchase Details
Closed on
Jan 17, 2007
Sold by
Warren Rahmana and Warren Herbert E
Bought by
Jones Chad
Home Financials for this Owner
Home Financials are based on the most recent Mortgage that was taken out on this home.
Original Mortgage
$64,000
Interest Rate
9.7%
Mortgage Type
Balloon
Create a Home Valuation Report for This Property
The Home Valuation Report is an in-depth analysis detailing your home's value as well as a comparison with similar homes in the area
Home Values in the Area
Average Home Value in this Area
Purchase History
| Date | Buyer | Sale Price | Title Company |
|---|---|---|---|
| Peppa Properties Llc | -- | None Available | |
| Stonebreaker Enterprises Llc | $21,000 | First American Title | |
| Arch Bay Holdings Llc Series 2008B | -- | First American Title | |
| Property Asset Management Inc | -- | None Available | |
| Jones Chad | $64,000 | First American Title & Tr Co |
Source: Public Records
Mortgage History
| Date | Status | Borrower | Loan Amount |
|---|---|---|---|
| Previous Owner | Jones Chad | $64,000 |
Source: Public Records
Tax History Compared to Growth
Tax History
| Year | Tax Paid | Tax Assessment Tax Assessment Total Assessment is a certain percentage of the fair market value that is determined by local assessors to be the total taxable value of land and additions on the property. | Land | Improvement |
|---|---|---|---|---|
| 2024 | $672 | $5,748 | $1,201 | $4,547 |
| 2023 | $672 | $5,474 | $1,210 | $4,264 |
| 2022 | $613 | $5,213 | $700 | $4,513 |
| 2021 | $584 | $4,965 | $855 | $4,110 |
| 2020 | $563 | $4,729 | $902 | $3,827 |
| 2019 | $536 | $4,504 | $963 | $3,541 |
| 2018 | $487 | $4,290 | $0 | $0 |
| 2017 | $465 | $4,099 | $1,022 | $3,077 |
| 2016 | $443 | $3,904 | $1,070 | $2,834 |
| 2015 | $470 | $4,104 | $1,070 | $3,034 |
| 2014 | $453 | $3,977 | $1,045 | $2,932 |
Source: Public Records
Map
Nearby Homes
- 245 NW 80th St
- 321 NW 80th St
- 333 NW 80th St
- 201 NW 85th St
- 332 NW 86th St
- 113 NW 79th St
- 213 NW 86th St
- 328 NW 88th St
- 336 NW 89th St
- 329 NW 89th St
- 325 NW 89th St
- 421 NW 89th St
- 729 NW 86th St
- 321 NW 91st St
- 428 NW 91st St
- 615 NW 90th St
- 1004 NW 79th St
- 737 NW 89th St
- 904 NW 88th St
- 913 NW 87th St
- 229 NW 82nd St
- 237 NW 82nd St
- 225 NW 82nd St
- 221 NW 82nd St
- 234 NW 82nd St
- 245 NW 82nd St
- 228 NW 83rd St
- 240 NW 83rd St
- 224 NW 83rd St
- 217 NW 82nd St
- 8216 N Harvey Place
- 249 NW 82nd St
- 220 NW 83rd St
- 244 NW 83rd St
- 224 NW 82nd St
- 213 NW 82nd St
- 8212 N Harvey Place
- 216 NW 83rd St
- 253 NW 82nd St
- 248 NW 83rd St