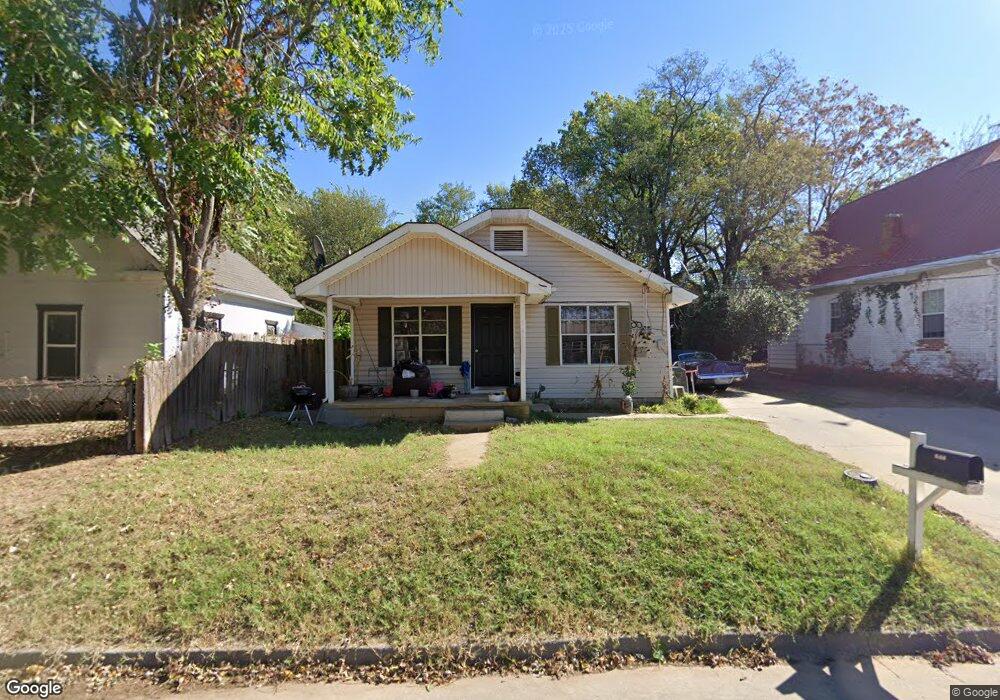
233 S Draper Ave Shawnee, OK 74801
Estimated Value: $54,000 - $91,000
3
Beds
1
Bath
1,199
Sq Ft
$56/Sq Ft
Est. Value
About This Home
This home is located at 233 S Draper Ave, Shawnee, OK 74801 and is currently estimated at $66,618, approximately $55 per square foot. 233 S Draper Ave is a home located in Pottawatomie County with nearby schools including Horace Mann Elementary School, Shawnee Middle School, and Shawnee High School.
Ownership History
Date
Name
Owned For
Owner Type
Purchase Details
Closed on
Apr 5, 2023
Sold by
Tuff Homes Llc
Bought by
Gz Management Llc
Current Estimated Value
Home Financials for this Owner
Home Financials are based on the most recent Mortgage that was taken out on this home.
Original Mortgage
$31,850
Outstanding Balance
$5,736
Interest Rate
6.33%
Mortgage Type
New Conventional
Estimated Equity
$60,882
Purchase Details
Closed on
Feb 24, 2023
Sold by
Jones Debra Kay and Jones Douglas W
Bought by
Tuff Homes Llc
Home Financials for this Owner
Home Financials are based on the most recent Mortgage that was taken out on this home.
Original Mortgage
$31,850
Outstanding Balance
$5,736
Interest Rate
6.33%
Mortgage Type
New Conventional
Estimated Equity
$60,882
Purchase Details
Closed on
Apr 1, 2016
Sold by
Wilson Emmet L and Wilson Mary Beth
Bought by
Jones Debra Kay
Purchase Details
Closed on
Apr 9, 1998
Sold by
Osborne David and Osborne Clara
Bought by
Wilson Emmet and Wilson Mary
Create a Home Valuation Report for This Property
The Home Valuation Report is an in-depth analysis detailing your home's value as well as a comparison with similar homes in the area
Home Values in the Area
Average Home Value in this Area
Purchase History
| Date | Buyer | Sale Price | Title Company |
|---|---|---|---|
| Gz Management Llc | $45,000 | Oklahoma City Abstract | |
| Tuff Homes Llc | $27,833 | Oklahoma City Abstract | |
| Jones Debra Kay | $20,000 | None Available | |
| Wilson Emmet | $11,000 | -- |
Source: Public Records
Mortgage History
| Date | Status | Borrower | Loan Amount |
|---|---|---|---|
| Open | Tuff Homes Llc | $31,850 |
Source: Public Records
Tax History Compared to Growth
Tax History
| Year | Tax Paid | Tax Assessment Tax Assessment Total Assessment is a certain percentage of the fair market value that is determined by local assessors to be the total taxable value of land and additions on the property. | Land | Improvement |
|---|---|---|---|---|
| 2024 | $335 | $5,685 | $475 | $5,210 |
| 2023 | $335 | $3,202 | $270 | $2,932 |
| 2022 | $313 | $3,050 | $255 | $2,795 |
| 2021 | $293 | $2,905 | $240 | $2,665 |
| 2020 | $281 | $2,778 | $229 | $2,549 |
| 2019 | $276 | $2,646 | $218 | $2,428 |
| 2018 | $258 | $2,520 | $211 | $2,309 |
| 2017 | $242 | $2,400 | $475 | $1,925 |
| 2016 | $290 | $2,844 | $475 | $2,369 |
| 2015 | $271 | $2,709 | $475 | $2,234 |
| 2014 | $258 | $2,580 | $475 | $2,105 |
Source: Public Records
Map
Nearby Homes
- 121 S Center Ave
- 209 S Ruth Ave
- 1330 E Main St
- 1600 E Farrall
- 209 S Eden Ave
- 1201 E Main St
- 124 N Pesotum Ave
- 201 S Dixon Ave
- 1015 E Main St
- 1326 E 10th St
- 1328 E 10th St
- 1127 E 10th St
- 322 N Draper Ave
- 210 N Roosevelt Ave
- 1119 E 11th St
- 1103 E 11th St
- 1330 E Whittaker St
- 915 E Whittaker St
- 418 S Penn Ave
- 321 N Mckinley Ave
- 229 S Draper Ave
- 237 S Draper Ave
- 225 S Draper Ave
- 220 S Osage Ave
- 222 S Osage Ave
- 223 S Draper Ave
- 301 S Draper Ave
- 218 S Osage Ave
- 311 S Draper Ave
- 216 S Osage Ave
- 221 S Draper Ave
- 226 S Draper Ave
- 302 S Osage Ave
- 302 S Draper Ave
- 214 S Osage Ave
- 219 S Draper Ave
- 304 S Draper Ave
- 224 S Draper Ave
- 222 S Draper Ave
- 309 S Draper Ave