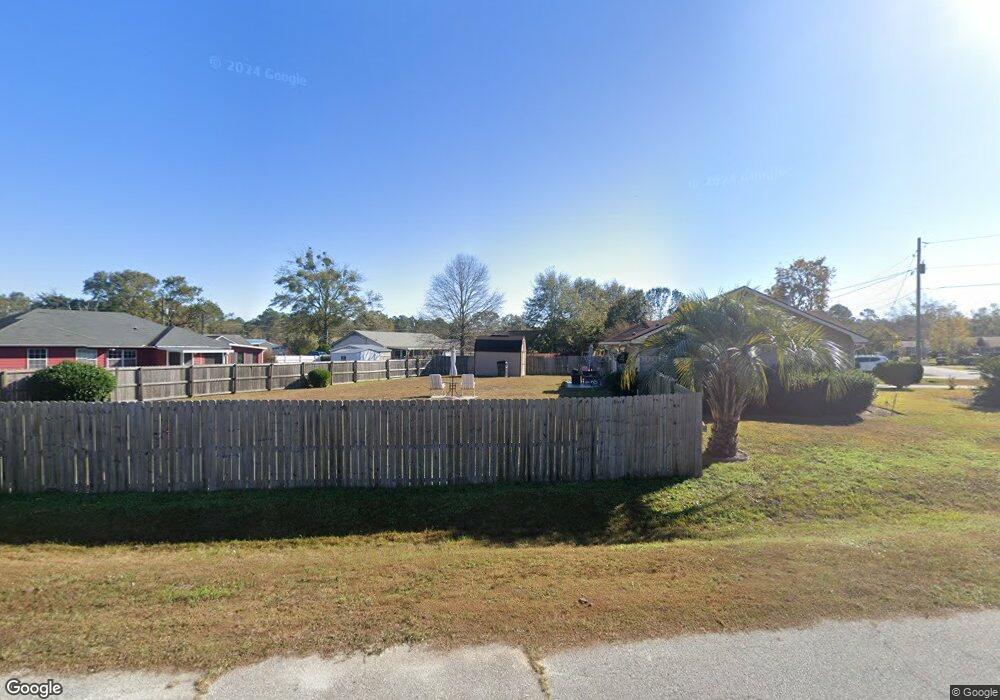
233 Sabreena Cir Hinesville, GA 31313
Estimated Value: $212,000 - $271,000
3
Beds
2
Baths
1,230
Sq Ft
$191/Sq Ft
Est. Value
About This Home
This home is located at 233 Sabreena Cir, Hinesville, GA 31313 and is currently estimated at $235,459, approximately $191 per square foot. 233 Sabreena Cir is a home located in Liberty County with nearby schools including Lyman Hall Elementary School, Lewis Frasier Middle School, and Bradwell Institute.
Ownership History
Date
Name
Owned For
Owner Type
Purchase Details
Closed on
Aug 5, 2024
Sold by
Loe Erick
Bought by
Morris Michael Lee
Current Estimated Value
Home Financials for this Owner
Home Financials are based on the most recent Mortgage that was taken out on this home.
Original Mortgage
$234,945
Outstanding Balance
$232,327
Interest Rate
6.95%
Mortgage Type
New Conventional
Estimated Equity
$3,132
Purchase Details
Closed on
Jul 12, 2021
Sold by
Wilson Greyson Taylor
Bought by
Loe Erick
Home Financials for this Owner
Home Financials are based on the most recent Mortgage that was taken out on this home.
Original Mortgage
$165,726
Interest Rate
2.96%
Mortgage Type
VA
Purchase Details
Closed on
Nov 9, 2017
Sold by
Uptegrove Logan H
Bought by
Wilson Greyson Taylor
Home Financials for this Owner
Home Financials are based on the most recent Mortgage that was taken out on this home.
Original Mortgage
$116,451
Interest Rate
3.91%
Mortgage Type
VA
Purchase Details
Closed on
Dec 17, 2015
Sold by
Cooke Richard W
Bought by
Uptegrove Logan H
Home Financials for this Owner
Home Financials are based on the most recent Mortgage that was taken out on this home.
Original Mortgage
$107,257
Interest Rate
3.98%
Mortgage Type
VA
Purchase Details
Closed on
Aug 17, 2015
Sold by
Sec Of Veterans Affa
Bought by
Cooke Richard W
Home Financials for this Owner
Home Financials are based on the most recent Mortgage that was taken out on this home.
Original Mortgage
$71,400
Interest Rate
4.16%
Mortgage Type
New Conventional
Purchase Details
Closed on
Apr 7, 2015
Sold by
Everbank
Bought by
The Sec Of Veterans Affa
Purchase Details
Closed on
Feb 29, 2008
Sold by
Clarence Gadson Homes Llc
Bought by
Mccray Bruce L
Home Financials for this Owner
Home Financials are based on the most recent Mortgage that was taken out on this home.
Original Mortgage
$103,171
Interest Rate
5.63%
Mortgage Type
New Conventional
Purchase Details
Closed on
Sep 19, 2005
Sold by
Gadson Clarence
Bought by
Clarence Gadson Homes Llc
Purchase Details
Closed on
Aug 9, 2002
Sold by
Sec Of V A
Bought by
Gadson Clarence
Purchase Details
Closed on
Feb 26, 2002
Sold by
Washington Mutual Home Loans I
Bought by
Sec Of V A
Purchase Details
Closed on
May 7, 1995
Sold by
Trinity Land Development
Bought by
Futch Ray
Purchase Details
Closed on
Apr 13, 1995
Sold by
Futch Ray Builders
Bought by
Bewley Stephen R
Purchase Details
Closed on
Aug 19, 1994
Bought by
Trinity Land Development
Create a Home Valuation Report for This Property
The Home Valuation Report is an in-depth analysis detailing your home's value as well as a comparison with similar homes in the area
Home Values in the Area
Average Home Value in this Area
Purchase History
| Date | Buyer | Sale Price | Title Company |
|---|---|---|---|
| Morris Michael Lee | $230,000 | -- | |
| Loe Erick | $162,000 | -- | |
| Wilson Greyson Taylor | $114,000 | -- | |
| Uptegrove Logan H | $105,000 | -- | |
| Cooke Richard W | -- | -- | |
| The Sec Of Veterans Affa | $64,893 | -- | |
| Everbank | $64,893 | -- | |
| Mccray Bruce L | $101,000 | -- | |
| Clarence Gadson Homes Llc | -- | -- | |
| Gadson Clarence | $64,000 | -- | |
| Sec Of V A | -- | -- | |
| Washington Mutual Home Loans Inc | -- | -- | |
| Futch Ray | $11,000 | -- | |
| Bewley Stephen R | $63,500 | -- | |
| Ray Futch Builders | -- | -- | |
| Trinity Land Development | -- | -- |
Source: Public Records
Mortgage History
| Date | Status | Borrower | Loan Amount |
|---|---|---|---|
| Open | Morris Michael Lee | $234,945 | |
| Previous Owner | Loe Erick | $165,726 | |
| Previous Owner | Wilson Greyson Taylor | $116,451 | |
| Previous Owner | Uptegrove Logan H | $107,257 | |
| Previous Owner | Cooke Richard W | $71,400 | |
| Previous Owner | Mccray Bruce L | $103,171 |
Source: Public Records
Tax History Compared to Growth
Tax History
| Year | Tax Paid | Tax Assessment Tax Assessment Total Assessment is a certain percentage of the fair market value that is determined by local assessors to be the total taxable value of land and additions on the property. | Land | Improvement |
|---|---|---|---|---|
| 2024 | $3,414 | $82,492 | $14,000 | $68,492 |
| 2023 | $3,414 | $65,940 | $10,000 | $55,940 |
| 2022 | $2,026 | $52,234 | $6,800 | $45,434 |
| 2021 | $1,628 | $42,065 | $6,800 | $35,265 |
| 2020 | $1,587 | $40,849 | $6,800 | $34,049 |
| 2019 | $1,561 | $41,236 | $6,800 | $34,436 |
| 2018 | $1,556 | $41,622 | $6,800 | $34,822 |
| 2017 | $1,552 | $36,573 | $6,800 | $29,773 |
| 2016 | $1,288 | $36,941 | $6,800 | $30,141 |
| 2015 | $1,186 | $33,670 | $6,400 | $27,270 |
| 2014 | $1,186 | $38,622 | $8,400 | $30,222 |
| 2013 | -- | $37,657 | $7,200 | $30,457 |
Source: Public Records
Map
Nearby Homes
- 193 Sabreena Cir
- 391 Sabreena Cir
- 113 Kevin Rd
- 218 Kevin Rd
- 74 Rosebud Ct
- 0 & 1 Denise Ln
- 48 Beaumont Dr
- 28 Beaumont Dr
- 34 Beaumont Dr
- 32 Beaumont Dr
- 2324 Suttle Ct
- 2411 Fernando Ct
- 418 Lancaster Loop
- 89 Salette St
- 619 Mccumber Dr
- 316 Clairemore Cir
- 16 Kelly Ln
- 118 Boundary Hall Way
- 81 Boundary Hall Way