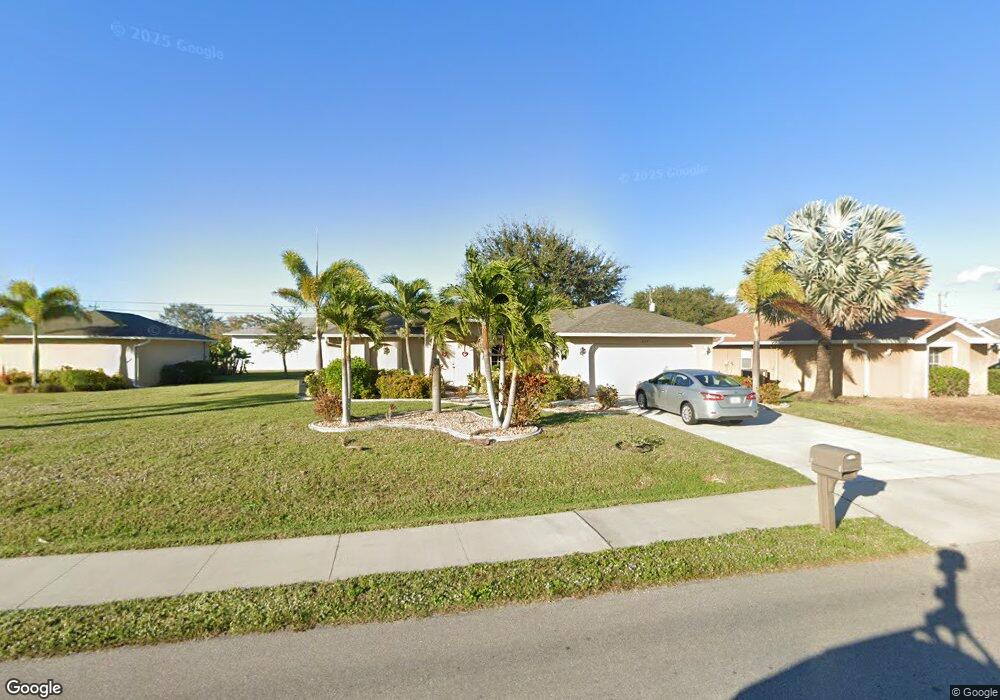
233 SE 8th St Cape Coral, FL 33990
Hancock NeighborhoodEstimated Value: $287,292 - $385,000
3
Beds
2
Baths
1,365
Sq Ft
$234/Sq Ft
Est. Value
About This Home
This home is located at 233 SE 8th St, Cape Coral, FL 33990 and is currently estimated at $320,073, approximately $234 per square foot. 233 SE 8th St is a home located in Lee County with nearby schools including Caloosa Elementary School, Hancock Creek Elementary School, and Tropic Isles Elementary School.
Ownership History
Date
Name
Owned For
Owner Type
Purchase Details
Closed on
Jul 21, 2025
Sold by
Giglio Martin
Bought by
Martin Giglio Living Trust and Giglio
Current Estimated Value
Purchase Details
Closed on
Aug 14, 2009
Sold by
Kent J Caldwell & Entrust Ira Sw Florida
Bought by
Giglio Martin
Purchase Details
Closed on
Jul 7, 2009
Sold by
Stamand Larry
Bought by
Swfl Entrust Ira and Kent J Caldwell Ira
Purchase Details
Closed on
May 4, 2006
Sold by
Lvfl Properties Inc
Bought by
St Amand Larry
Home Financials for this Owner
Home Financials are based on the most recent Mortgage that was taken out on this home.
Original Mortgage
$201,000
Interest Rate
6.41%
Mortgage Type
Fannie Mae Freddie Mac
Purchase Details
Closed on
Feb 17, 2005
Sold by
Look Geraldine J
Bought by
Lvfl Properties Inc
Create a Home Valuation Report for This Property
The Home Valuation Report is an in-depth analysis detailing your home's value as well as a comparison with similar homes in the area
Home Values in the Area
Average Home Value in this Area
Purchase History
| Date | Buyer | Sale Price | Title Company |
|---|---|---|---|
| Martin Giglio Living Trust | $100 | None Listed On Document | |
| Giglio Martin | $135,000 | Stewart Title Company | |
| Swfl Entrust Ira | $59,900 | None Available | |
| St Amand Larry | -- | Fidelity National Title Ins | |
| Lvfl Properties Inc | $85,000 | Bay Title Services |
Source: Public Records
Mortgage History
| Date | Status | Borrower | Loan Amount |
|---|---|---|---|
| Previous Owner | St Amand Larry | $201,000 |
Source: Public Records
Tax History Compared to Growth
Tax History
| Year | Tax Paid | Tax Assessment Tax Assessment Total Assessment is a certain percentage of the fair market value that is determined by local assessors to be the total taxable value of land and additions on the property. | Land | Improvement |
|---|---|---|---|---|
| 2025 | $2,006 | $109,412 | -- | -- |
| 2024 | $2,006 | $106,328 | -- | -- |
| 2023 | $5,027 | $224,355 | $0 | $0 |
| 2022 | $4,286 | $203,959 | $0 | $0 |
| 2021 | $3,912 | $192,849 | $31,000 | $161,849 |
| 2020 | $3,716 | $175,223 | $31,000 | $144,223 |
| 2019 | $3,483 | $171,997 | $25,000 | $146,997 |
| 2018 | $3,308 | $162,311 | $25,000 | $137,311 |
| 2017 | $3,159 | $155,034 | $19,000 | $136,034 |
| 2016 | $2,891 | $138,703 | $19,000 | $119,703 |
| 2015 | $2,640 | $117,306 | $18,000 | $99,306 |
| 2014 | -- | $115,495 | $12,032 | $103,463 |
| 2013 | -- | $86,498 | $5,300 | $81,198 |
Source: Public Records
Map
Nearby Homes
- 309 SE 8th St
- 217 SE 7th St
- 824 SE 3rd Place
- 223 Destiny Cir
- 202 SE 1st Place
- 213 SE 6th St
- 140 SE 8th St
- 238 SE 9th Terrace
- 904 SE 4th Place
- 260 Destiny Cir
- 134 SE 8th St
- 159 SE 6th St
- 501 SE 7th St
- 505 SE 7th St
- 507 SE 8th Terrace
- 504 SE 6th Terrace Unit A-B
- 817 SE 5th Place
- 519/521 SE 6th Terrace
- 903 SE 5th Place
- 814 Santa Barbara Blvd