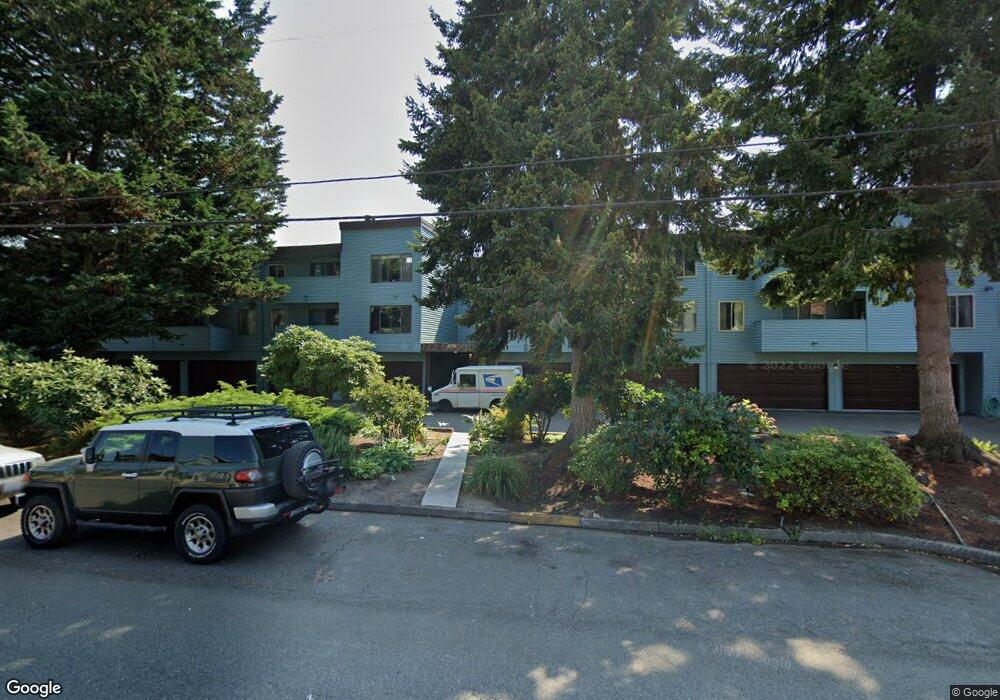
233 SW 154th St Unit 105 Burien, WA 98166
Downtown Burien NeighborhoodEstimated Value: $297,000 - $367,000
2
Beds
1
Bath
1,010
Sq Ft
$324/Sq Ft
Est. Value
About This Home
This home is located at 233 SW 154th St Unit 105, Burien, WA 98166 and is currently estimated at $327,064, approximately $323 per square foot. 233 SW 154th St Unit 105 is a home located in King County with nearby schools including Gregory Heights Elementary School, Sylvester Middle School, and Highline High School.
Ownership History
Date
Name
Owned For
Owner Type
Purchase Details
Closed on
Nov 10, 2015
Sold by
Carroll Richard E
Bought by
Neville Larry and Neville Ann Penberthy
Current Estimated Value
Home Financials for this Owner
Home Financials are based on the most recent Mortgage that was taken out on this home.
Original Mortgage
$104,750
Outstanding Balance
$82,307
Interest Rate
3.76%
Mortgage Type
New Conventional
Estimated Equity
$244,757
Purchase Details
Closed on
Apr 26, 2004
Sold by
Bellah Jon
Bought by
Carroll Richard E
Home Financials for this Owner
Home Financials are based on the most recent Mortgage that was taken out on this home.
Original Mortgage
$116,350
Interest Rate
5.35%
Mortgage Type
FHA
Purchase Details
Closed on
May 17, 2001
Sold by
Bostick Valentina
Bought by
Bellah Jon
Home Financials for this Owner
Home Financials are based on the most recent Mortgage that was taken out on this home.
Original Mortgage
$96,900
Interest Rate
7.06%
Create a Home Valuation Report for This Property
The Home Valuation Report is an in-depth analysis detailing your home's value as well as a comparison with similar homes in the area
Home Values in the Area
Average Home Value in this Area
Purchase History
| Date | Buyer | Sale Price | Title Company |
|---|---|---|---|
| Neville Larry | $144,750 | Stewart Title | |
| Carroll Richard E | $119,950 | Stewart Title | |
| Bellah Jon | $102,000 | Evergreen Title Company Inc |
Source: Public Records
Mortgage History
| Date | Status | Borrower | Loan Amount |
|---|---|---|---|
| Open | Neville Larry | $104,750 | |
| Previous Owner | Carroll Richard E | $116,350 | |
| Previous Owner | Bellah Jon | $96,900 |
Source: Public Records
Tax History Compared to Growth
Tax History
| Year | Tax Paid | Tax Assessment Tax Assessment Total Assessment is a certain percentage of the fair market value that is determined by local assessors to be the total taxable value of land and additions on the property. | Land | Improvement |
|---|---|---|---|---|
| 2024 | $3,589 | $326,000 | $17,100 | $308,900 |
| 2023 | $2,952 | $324,000 | $16,900 | $307,100 |
| 2022 | $3,315 | $273,000 | $16,400 | $256,600 |
| 2021 | $3,119 | $271,000 | $14,400 | $256,600 |
| 2020 | $2,636 | $246,000 | $14,100 | $231,900 |
| 2018 | $2,195 | $185,000 | $10,900 | $174,100 |
| 2017 | $2,018 | $157,000 | $10,900 | $146,100 |
| 2016 | $1,725 | $146,000 | $10,900 | $135,100 |
| 2015 | $1,486 | $129,000 | $13,700 | $115,300 |
| 2014 | -- | $106,000 | $13,700 | $92,300 |
| 2013 | -- | $100,000 | $13,700 | $86,300 |
Source: Public Records
Map
Nearby Homes
- 221 SW 154th St Unit 8
- 440 SW 155th St
- 439 SW 156th St
- 620 SW 155th St
- 15100 6th Ave SW Unit 325
- 15100 6th Ave SW Unit 728
- 15100 6th Ave SW Unit 528
- 15609 8th Ave SW
- 15220 9th Ave SW
- 15212 9th Ave SW
- 817 SW 158th St
- 236 S 152nd St Unit 104
- 236 S 152nd St Unit 105
- 15421 10th Ave SW
- 259 S 156th St Unit 1-4
- 14630 3rd Ave SW
- 16020 7th Ave SW
- 1017 SW 154th St
- 15711 4th Ave S Unit 22
- 15002 4th Ave S
- 233 SW 154th St
- 233 SW 154th St Unit 308
- 233 SW 154th St Unit 107
- 233 SW 154th St Unit 211
- 233 SW 154th St Unit 204
- 233 SW 154th St Unit 212
- 233 SW 154th St Unit 206
- 233 SW 154th St Unit 306
- 233 SW 154th St Unit 208
- 233 SW 154th St Unit 307
- 233 SW 154th St Unit 104
- 233 SW 154th St Unit 205
- 233 SW 154th St Unit 310
- 233 SW 154th St Unit 106
- 233 SW 154th St Unit 101
- 233 SW 154th St Unit 304
- 233 SW 154th St Unit 207
- 233 SW 154th St Unit 312
- 233 SW 154th St Unit 103
- 233 SW 154th St Unit 209