Estimated Value: $233,000 - $250,000
3
Beds
2
Baths
1,610
Sq Ft
$151/Sq Ft
Est. Value
About This Home
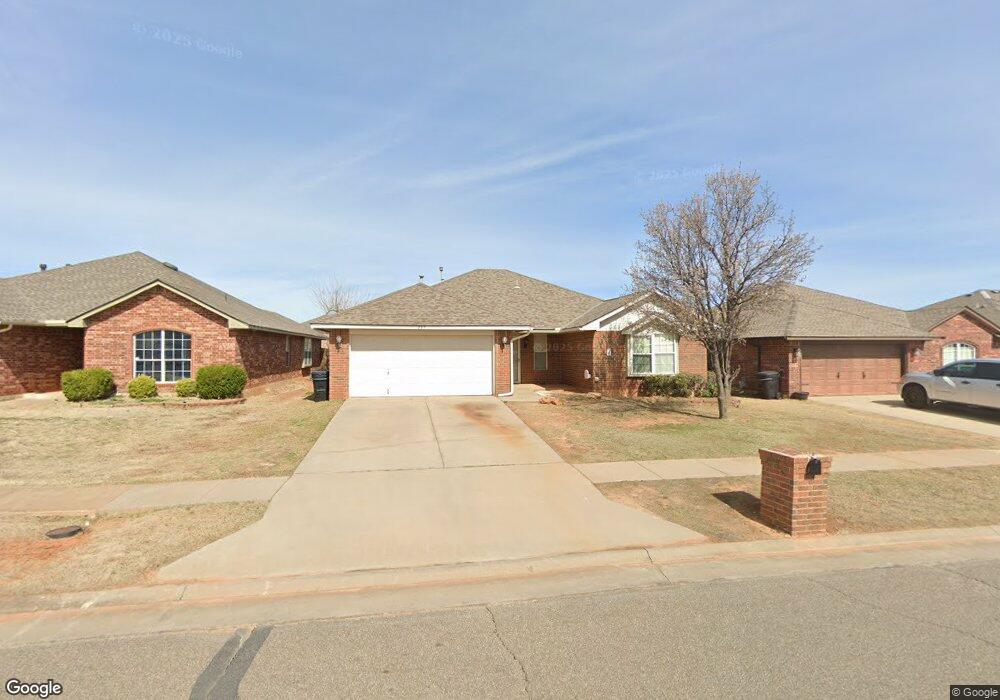
This home is located at 233 SW 39th St, Moore, OK 73160 and is currently estimated at $242,988, approximately $150 per square foot. 233 SW 39th St is a home located in Cleveland County with nearby schools including Broadmoore Elementary School, Highland East Junior High School, and Moore High School.
Ownership History
Date
Name
Owned For
Owner Type
Purchase Details
Closed on
Jul 31, 2007
Sold by
Garza James A
Bought by
Cherry Onlia D and Cherry Paulme
Current Estimated Value
Home Financials for this Owner
Home Financials are based on the most recent Mortgage that was taken out on this home.
Original Mortgage
$136,825
Outstanding Balance
$86,940
Interest Rate
6.73%
Mortgage Type
FHA
Estimated Equity
$156,048
Purchase Details
Closed on
May 7, 2004
Sold by
Colony Homes, Inc
Bought by
Garza James A
Create a Home Valuation Report for This Property
The Home Valuation Report is an in-depth analysis detailing your home's value as well as a comparison with similar homes in the area
Home Values in the Area
Average Home Value in this Area
Purchase History
| Date | Buyer | Sale Price | Title Company |
|---|---|---|---|
| Cherry Onlia D | $138,000 | None Available | |
| Garza James A | $128,500 | -- |
Source: Public Records
Mortgage History
| Date | Status | Borrower | Loan Amount |
|---|---|---|---|
| Open | Cherry Onlia D | $136,825 |
Source: Public Records
Tax History Compared to Growth
Tax History
| Year | Tax Paid | Tax Assessment Tax Assessment Total Assessment is a certain percentage of the fair market value that is determined by local assessors to be the total taxable value of land and additions on the property. | Land | Improvement |
|---|---|---|---|---|
| 2024 | $2,491 | $20,529 | $3,499 | $17,030 |
| 2023 | $2,383 | $19,551 | $3,282 | $16,269 |
| 2022 | $2,303 | $18,620 | $3,803 | $14,817 |
| 2021 | $2,203 | $17,733 | $3,935 | $13,798 |
| 2020 | $2,101 | $16,889 | $2,863 | $14,026 |
| 2019 | $2,037 | $16,085 | $2,741 | $13,344 |
| 2018 | $1,940 | $15,319 | $1,980 | $13,339 |
| 2017 | $1,950 | $15,319 | $0 | $0 |
| 2016 | $1,965 | $15,319 | $1,980 | $13,339 |
| 2015 | $1,795 | $15,478 | $1,980 | $13,498 |
| 2014 | $1,830 | $15,407 | $1,980 | $13,427 |
Source: Public Records
Map
Nearby Homes
- 4000 Queens Dr
- 4008 Red Apple Cir
- 4208 Olde Copper Creek Rd
- 3624 Green Apple Place
- 104 SE 34th St
- 3600 Country Club
- 4515 Baldwin Ave
- 3604 Necia St
- 623 SW 37th St
- 4412 Brooklyn Ave
- 3513 Shannon Dr
- 513 SE 34th St
- 517 SE 34th St
- 4000 S Broadway St
- 605 SE 34th St
- 824 SE 38th St
- 708 Carol Ann Place
- 308 Jeffrey Laird Place
- 700 SW 45th St
- 4208 Mahogany Hills Dr
- 301 SW 39th St
- 229 SW 39th St
- 305 SW 39th St
- 225 SW 39th St
- 309 SW 39th St
- 300 SW 39th St
- 200 SW 40th St
- 3829 Central Park Dr
- 304 SW 39th St
- 313 SW 39th St
- 3825 Central Park Dr
- 204 SW 40th St
- 308 SW 39th St
- 3821 Central Park Dr
- 317 SW 39th St
- 312 SW 39th St
- 208 SW 40th St
- 4001 Applegate Dr
- 301 SW 40th St
- 3817 Central Park Dr