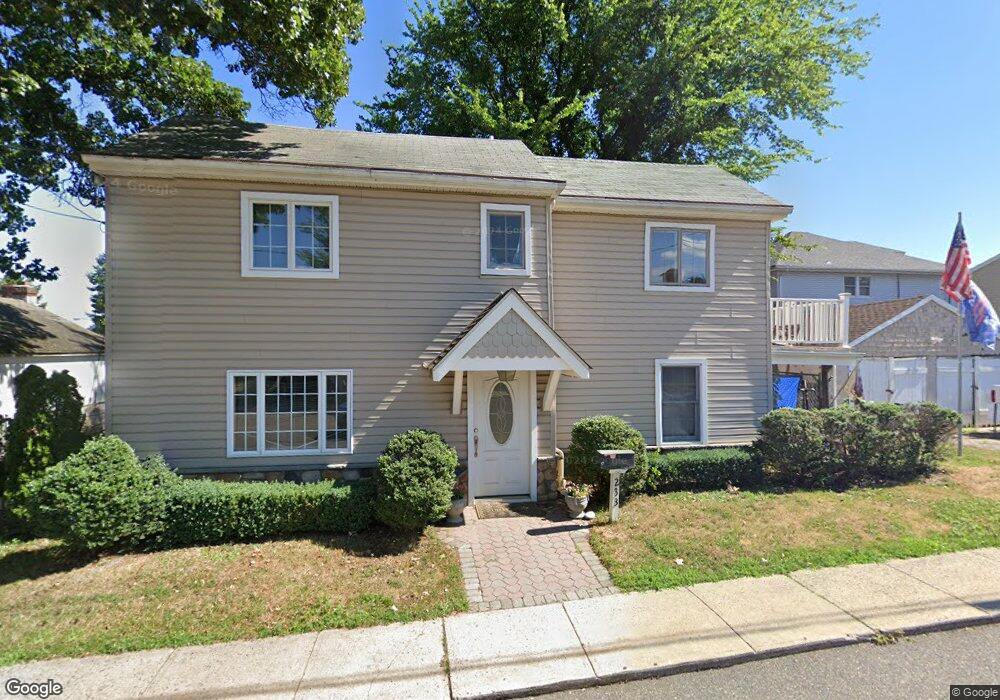
233 W Front St Keyport, NJ 07735
Estimated Value: $501,000 - $527,000
2
Beds
2
Baths
1,440
Sq Ft
$356/Sq Ft
Est. Value
About This Home
This home is located at 233 W Front St, Keyport, NJ 07735 and is currently estimated at $513,345, approximately $356 per square foot. 233 W Front St is a home located in Monmouth County with nearby schools including Keyport Central School, Keyport High School, and Icob Academy.
Ownership History
Date
Name
Owned For
Owner Type
Purchase Details
Closed on
Jan 17, 2008
Sold by
Lukanik Laura
Bought by
Richtmyer Paul A
Current Estimated Value
Home Financials for this Owner
Home Financials are based on the most recent Mortgage that was taken out on this home.
Original Mortgage
$236,250
Interest Rate
6.3%
Mortgage Type
Purchase Money Mortgage
Purchase Details
Closed on
Jul 24, 2000
Sold by
Orejuela Nelly
Bought by
Lukanik Laura
Home Financials for this Owner
Home Financials are based on the most recent Mortgage that was taken out on this home.
Original Mortgage
$108,810
Interest Rate
8.18%
Create a Home Valuation Report for This Property
The Home Valuation Report is an in-depth analysis detailing your home's value as well as a comparison with similar homes in the area
Home Values in the Area
Average Home Value in this Area
Purchase History
| Date | Buyer | Sale Price | Title Company |
|---|---|---|---|
| Richtmyer Paul A | $262,500 | None Available | |
| Lukanik Laura | $120,900 | -- |
Source: Public Records
Mortgage History
| Date | Status | Borrower | Loan Amount |
|---|---|---|---|
| Previous Owner | Richtmyer Paul A | $236,250 | |
| Previous Owner | Lukanik Laura | $108,810 |
Source: Public Records
Tax History Compared to Growth
Tax History
| Year | Tax Paid | Tax Assessment Tax Assessment Total Assessment is a certain percentage of the fair market value that is determined by local assessors to be the total taxable value of land and additions on the property. | Land | Improvement |
|---|---|---|---|---|
| 2025 | $8,266 | $437,300 | $203,600 | $233,700 |
| 2024 | $8,150 | $399,300 | $177,100 | $222,200 |
| 2023 | $8,150 | $370,800 | $161,000 | $209,800 |
| 2022 | $7,115 | $322,300 | $140,000 | $182,300 |
| 2021 | $7,115 | $281,900 | $129,600 | $152,300 |
| 2020 | $6,853 | $269,500 | $124,700 | $144,800 |
| 2019 | $6,637 | $261,400 | $119,900 | $141,500 |
| 2018 | $6,560 | $252,300 | $119,900 | $132,400 |
| 2017 | $6,418 | $246,200 | $115,400 | $130,800 |
| 2016 | $6,367 | $246,300 | $115,400 | $130,900 |
| 2015 | $5,999 | $231,000 | $101,900 | $129,100 |
| 2014 | $4,216 | $163,900 | $79,400 | $84,500 |
Source: Public Records
Map
Nearby Homes
- 95 Broadway
- 8 Chingarora Ave
- 54 Chingarora Ave
- 127 Chingarora Ave
- 253 Broadway
- 1 Hobart St
- 52 Highway 35
- 9 Monmouth Place
- 369 Riverdale Dr
- 910 Malden Dr
- 324 Maple Place
- 55 E Front St
- 40 Church St
- 226 Osborn St
- 358 Shadynook St
- 998 Woodmere Dr
- 811 Shore Concourse
- 345 Shadynook St
- 745 Cliffwood Ave
- 871 S Concourse