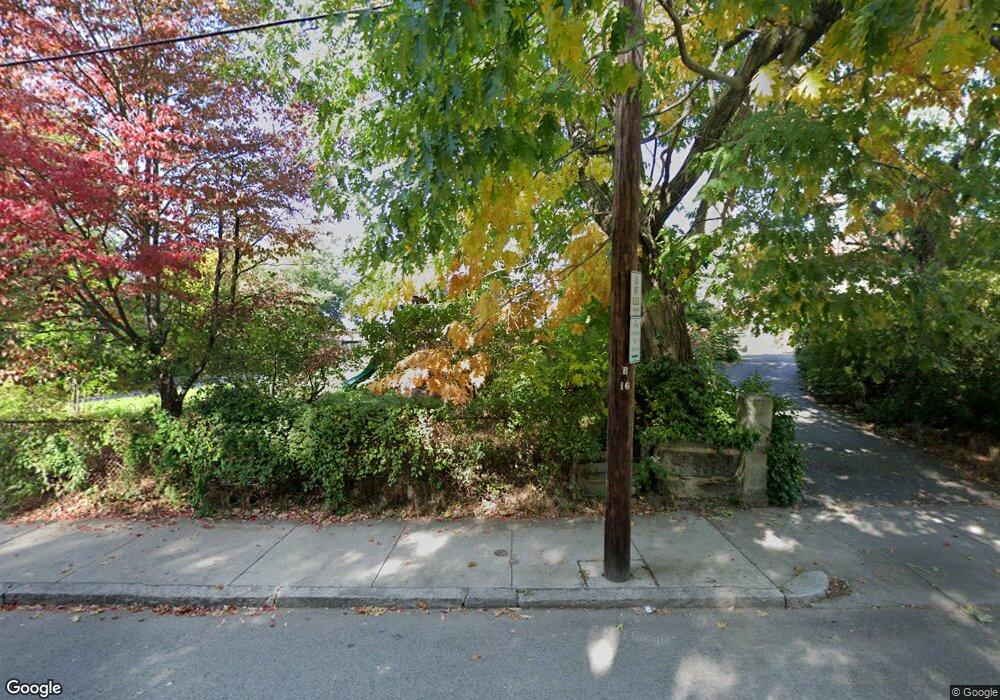
233 Walnut St Brookline, MA 02445
Brookline Village NeighborhoodEstimated Value: $2,147,000 - $2,686,000
5
Beds
3
Baths
2,700
Sq Ft
$919/Sq Ft
Est. Value
About This Home
This home is located at 233 Walnut St, Brookline, MA 02445 and is currently estimated at $2,482,175, approximately $919 per square foot. 233 Walnut St is a home located in Norfolk County with nearby schools including William H. Lincoln School, Brookline High School, and Match Charter Public School.
Ownership History
Date
Name
Owned For
Owner Type
Purchase Details
Closed on
Oct 27, 2011
Sold by
Sage Charlotte V Est
Bought by
Woo Tsungung W and Tien Elisabete P
Current Estimated Value
Home Financials for this Owner
Home Financials are based on the most recent Mortgage that was taken out on this home.
Original Mortgage
$792,800
Outstanding Balance
$542,957
Interest Rate
4.11%
Mortgage Type
Purchase Money Mortgage
Estimated Equity
$1,939,218
Create a Home Valuation Report for This Property
The Home Valuation Report is an in-depth analysis detailing your home's value as well as a comparison with similar homes in the area
Home Values in the Area
Average Home Value in this Area
Purchase History
| Date | Buyer | Sale Price | Title Company |
|---|---|---|---|
| Woo Tsungung W | $991,000 | -- |
Source: Public Records
Mortgage History
| Date | Status | Borrower | Loan Amount |
|---|---|---|---|
| Open | Woo Tsungung W | $792,800 |
Source: Public Records
Tax History
| Year | Tax Paid | Tax Assessment Tax Assessment Total Assessment is a certain percentage of the fair market value that is determined by local assessors to be the total taxable value of land and additions on the property. | Land | Improvement |
|---|---|---|---|---|
| 2025 | $23,899 | $2,421,400 | $1,751,500 | $669,900 |
| 2024 | $22,733 | $2,326,800 | $1,684,100 | $642,700 |
| 2023 | $19,765 | $1,982,400 | $1,306,000 | $676,400 |
| 2022 | $19,238 | $1,887,900 | $1,243,700 | $644,200 |
| 2021 | $17,790 | $1,815,300 | $1,195,900 | $619,400 |
| 2020 | $16,039 | $1,697,300 | $1,087,200 | $610,100 |
| 2019 | $12,624 | $1,347,300 | $1,035,400 | $311,900 |
| 2018 | $11,921 | $1,260,200 | $939,400 | $320,800 |
| 2017 | $11,746 | $1,188,900 | $886,300 | $302,600 |
| 2016 | $11,578 | $1,111,100 | $828,300 | $282,800 |
| 2015 | $11,090 | $1,038,400 | $774,100 | $264,300 |
| 2014 | $11,363 | $997,600 | $703,800 | $293,800 |
Source: Public Records
Map
Nearby Homes
- 236 Walnut St
- 8 Leverett St Unit 3
- 20 Rice St Unit 2
- 3 Upland Rd Unit 2
- 75-83 Boylston St Unit R3
- 42 Prince St
- 69 Walnut St Unit 2
- 69 Walnut St Unit 1
- 12 Thayer St
- 12 Goodwin Place Unit 12-1
- 12 Goodwin Place Unit 12-2
- 11 Goodwin Place Unit 1
- 11 Goodwin Place Unit 11-1
- 11 Goodwin Place Unit 11-2
- 71 Highland Rd
- 38 Juniper St Unit 108
- 124 Chestnut St Unit 2
- 370 Washington St
- 209 High St
- 18 Chestnut Place
- 233 Walnut St
- 235 Walnut St
- 235 Walnut St Unit 235
- 235 Walnut St
- 217 Walnut St
- 237 Walnut St Unit 237
- 237 Walnut St
- 220 Walnut St
- 230 Walnut St
- 210 Walnut St
- 239 Walnut St Unit 241
- 239 Walnut St Unit 2
- 239 Walnut St Unit 1
- 239 Walnut St Unit 3
- 0 Walnut Place
- 234 Walnut St
- 205 Walnut St
- 238 Walnut St
- 224 Walnut St
- 247 Walnut St
Your Personal Tour Guide
Ask me questions while you tour the home.