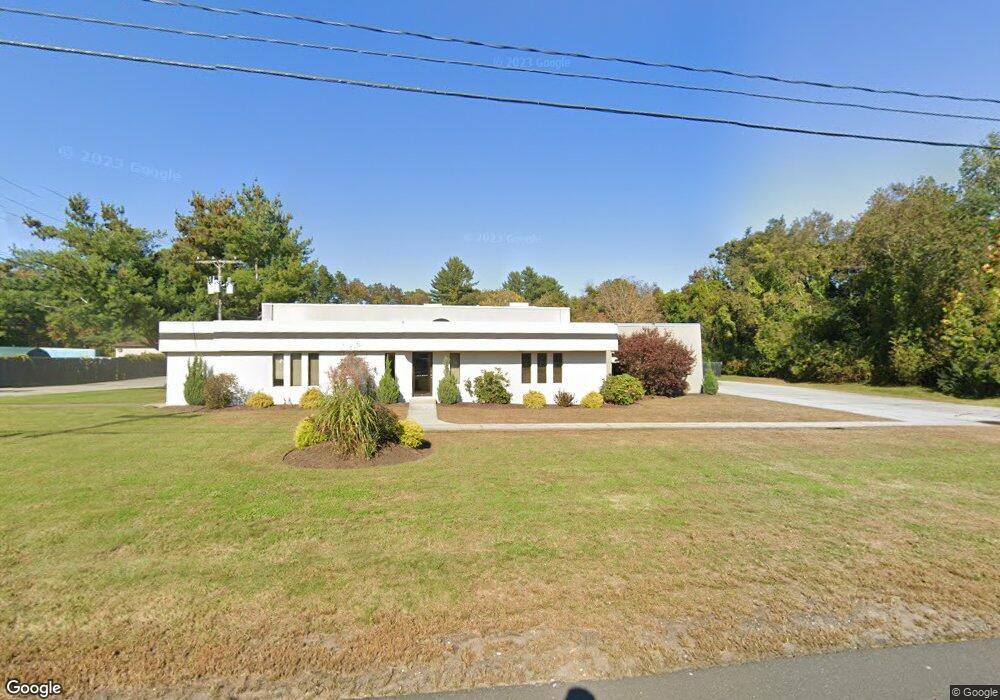
233 Willimantic Rd Columbia, CT 06237
Estimated Value: $1,514,675
--
Bed
--
Bath
6,432
Sq Ft
$235/Sq Ft
Est. Value
About This Home
This home is located at 233 Willimantic Rd, Columbia, CT 06237 and is currently estimated at $1,514,675, approximately $235 per square foot. 233 Willimantic Rd is a home located in Tolland County with nearby schools including Horace W. Porter School, Oak Grove Montessori School, and St Mary St Joseph School.
Ownership History
Date
Name
Owned For
Owner Type
Purchase Details
Closed on
Oct 1, 1993
Sold by
Pb Real Estate
Bought by
United Social Mental H
Current Estimated Value
Home Financials for this Owner
Home Financials are based on the most recent Mortgage that was taken out on this home.
Original Mortgage
$290,000
Interest Rate
1.5%
Mortgage Type
Purchase Money Mortgage
Create a Home Valuation Report for This Property
The Home Valuation Report is an in-depth analysis detailing your home's value as well as a comparison with similar homes in the area
Home Values in the Area
Average Home Value in this Area
Purchase History
| Date | Buyer | Sale Price | Title Company |
|---|---|---|---|
| United Social Mental H | $362,000 | -- |
Source: Public Records
Mortgage History
| Date | Status | Borrower | Loan Amount |
|---|---|---|---|
| Closed | United Social Mental H | $0 | |
| Closed | United Social Mental H | $793,000 | |
| Closed | United Social Mental H | $290,000 |
Source: Public Records
Tax History Compared to Growth
Tax History
| Year | Tax Paid | Tax Assessment Tax Assessment Total Assessment is a certain percentage of the fair market value that is determined by local assessors to be the total taxable value of land and additions on the property. | Land | Improvement |
|---|---|---|---|---|
| 2025 | $7,839 | $267,820 | $101,430 | $166,390 |
| 2024 | $7,531 | $267,820 | $101,430 | $166,390 |
| 2023 | $6,939 | $267,820 | $101,430 | $166,390 |
| 2022 | $6,929 | $267,820 | $101,430 | $166,390 |
| 2021 | $6,752 | $230,200 | $106,000 | $124,200 |
| 2020 | -- | $517,000 | $106,000 | $411,000 |
| 2019 | $0 | $517,000 | $106,000 | $411,000 |
| 2018 | -- | $517,000 | $106,000 | $411,000 |
| 2017 | $13,413 | $517,000 | $106,000 | $411,000 |
| 2016 | $13,413 | $494,400 | $93,500 | $400,900 |
| 2015 | $13,413 | $494,400 | $93,500 | $400,900 |
| 2014 | -- | $494,400 | $93,500 | $400,900 |
Source: Public Records
Map
Nearby Homes
- 26 Edgarton Rd
- 14 Edgarton Rd
- 45 MacHt Rd
- 6 Hilltop Ln
- 127 U S 6
- 7 Stone Wall Ln
- 0 Chowanec Rd
- 41 Oakwood Ln
- 44 Route 6
- 127 Route 87
- 4 Village Hill Rd
- 10 Lakeview Park
- 0 Oak Dr Unit LOT 33
- 0 South St Unit 24134981
- 4 Timber Trail
- 106 S Street Extension
- 103 S Street Extension
- 78 Hennequin Rd
- 43 Route 87
- 58 Candide Ln