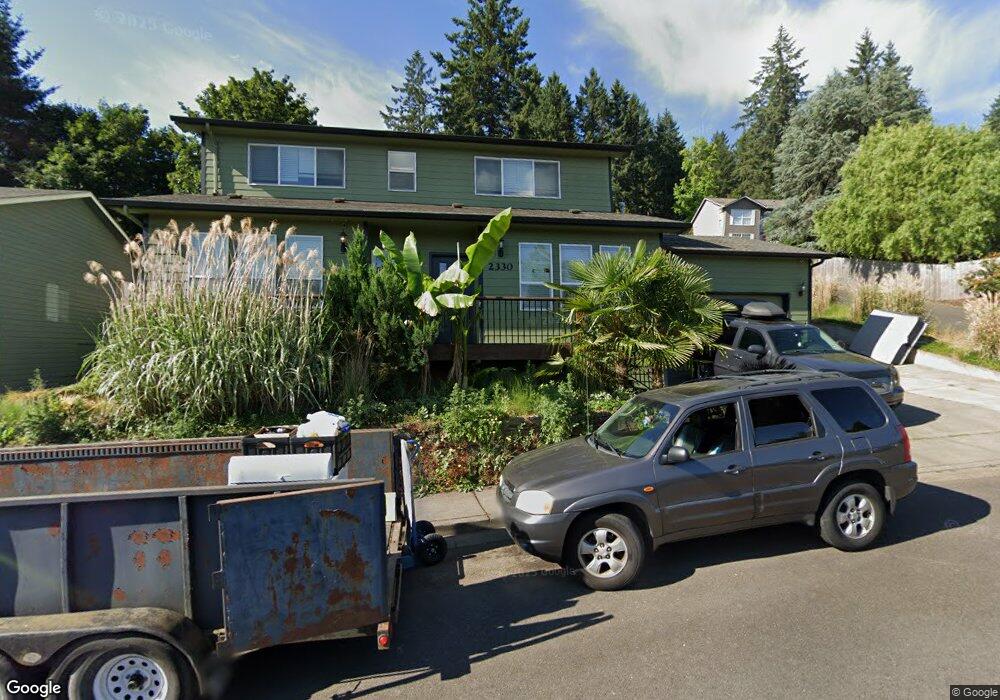
2330 Gibsonwoods Ct NW Salem, OR 97304
West Salem NeighborhoodEstimated Value: $528,000 - $581,000
4
Beds
4
Baths
2,193
Sq Ft
$249/Sq Ft
Est. Value
About This Home
This home is located at 2330 Gibsonwoods Ct NW, Salem, OR 97304 and is currently estimated at $545,837, approximately $248 per square foot. 2330 Gibsonwoods Ct NW is a home located in Polk County with nearby schools including Brush College Elementary School, Straub Middle School, and West Salem High School.
Ownership History
Date
Name
Owned For
Owner Type
Purchase Details
Closed on
Sep 11, 2007
Sold by
Ngin Sophar and Collier Brumley Chantele C
Bought by
Ngin Sophar and Collier Ngin Chantele C
Current Estimated Value
Purchase Details
Closed on
Aug 11, 2006
Sold by
Dales Properties Llc
Bought by
Collier Brumley Chantele C and Ngin Sophar
Home Financials for this Owner
Home Financials are based on the most recent Mortgage that was taken out on this home.
Original Mortgage
$254,500
Outstanding Balance
$152,798
Interest Rate
6.76%
Mortgage Type
Construction
Estimated Equity
$393,039
Purchase Details
Closed on
Feb 25, 2005
Sold by
Deerfield Properties Llc
Bought by
Dales Properties Llc
Purchase Details
Closed on
Dec 31, 2004
Sold by
Lafky Elton T
Bought by
Deerfield Properties Llc
Create a Home Valuation Report for This Property
The Home Valuation Report is an in-depth analysis detailing your home's value as well as a comparison with similar homes in the area
Home Values in the Area
Average Home Value in this Area
Purchase History
| Date | Buyer | Sale Price | Title Company |
|---|---|---|---|
| Ngin Sophar | -- | Lawyers Title | |
| Collier Brumley Chantele C | $75,000 | Lawyers Title Ins Corp | |
| Dales Properties Llc | $54,000 | Ticor Title | |
| Deerfield Properties Llc | -- | -- |
Source: Public Records
Mortgage History
| Date | Status | Borrower | Loan Amount |
|---|---|---|---|
| Open | Collier Brumley Chantele C | $254,500 |
Source: Public Records
Tax History Compared to Growth
Tax History
| Year | Tax Paid | Tax Assessment Tax Assessment Total Assessment is a certain percentage of the fair market value that is determined by local assessors to be the total taxable value of land and additions on the property. | Land | Improvement |
|---|---|---|---|---|
| 2025 | $4,691 | $256,390 | $57,570 | $198,820 |
| 2024 | $4,691 | $248,930 | $55,890 | $193,040 |
| 2023 | $4,555 | $241,680 | $54,260 | $187,420 |
| 2022 | $4,409 | $234,650 | $52,680 | $181,970 |
| 2021 | $4,283 | $227,820 | $51,150 | $176,670 |
| 2020 | $4,156 | $221,190 | $49,660 | $171,530 |
| 2019 | $4,011 | $214,750 | $48,220 | $166,530 |
| 2018 | $3,945 | $208,500 | $46,820 | $161,680 |
| 2017 | $3,555 | $202,430 | $45,450 | $156,980 |
| 2016 | $3,470 | $196,540 | $44,120 | $152,420 |
| 2015 | $3,500 | $190,820 | $42,840 | $147,980 |
| 2014 | $3,344 | $185,270 | $41,590 | $143,680 |
Source: Public Records
Map
Nearby Homes
- 2346 Gibsonwoods Ct NW
- 2386 Morrow Ct NW
- 2290 Morrow Ct NW
- 2396 Morrow Ct NW
- 2458 Morrow Ct NW
- 2468 Morrow Ct NW
- 2334 Doaks Ferry Rd NW
- 2038 W Park Ct NW
- 2719 Cherry Hill Ct NW
- 2110 Woodhaven Ct NW
- 2367 Wilark Dr NW
- 0 Morrow Ct NW Unit 715467966
- 2434 Benjamin Ave NW
- 2165 Teakwood Ave NW
- 2263 Banyonwood Ave NW
- 2388 Westminster Ave NW
- 2414 Cherry Blossom Dr NW
- 0 NW 2nd St
- 1835 Wakefield Ct NW
- 2438 Whetstone Ct NW
- 2310 Gibsonwoods Ct NW
- 2338 Gibsonwoods Ct NW
- 2350 Gibsonwoods Ct NW
- 2340 Gibsonwoods Ct NW
- 2325 Gibsonwoods Ct NW
- 2290 Gibsonwoods Ct NW
- 2280 Gibsonwoods Ct NW
- 2305 Gibsonwoods Ct NW
- 2345 Gibsonwoods Ct NW
- 2370 Gibsonwoods Ct NW
- 2295 Gibsonwoods Ct NW
- 2329 Emerald Dr NW
- 2348 Gibsonwoods Ct NW
- 2270 Gibsonwoods Ct NW
- 2260 Gibsonwoods Ct NW
- 0 Morrow (Parcel #544131) Ct NW
- 2275 Gibsonwoods Ct NW
- 2326 Morrow Ct NW
- 2380 Gibsonwoods Ct NW
- 2336 Morrow Ct NW