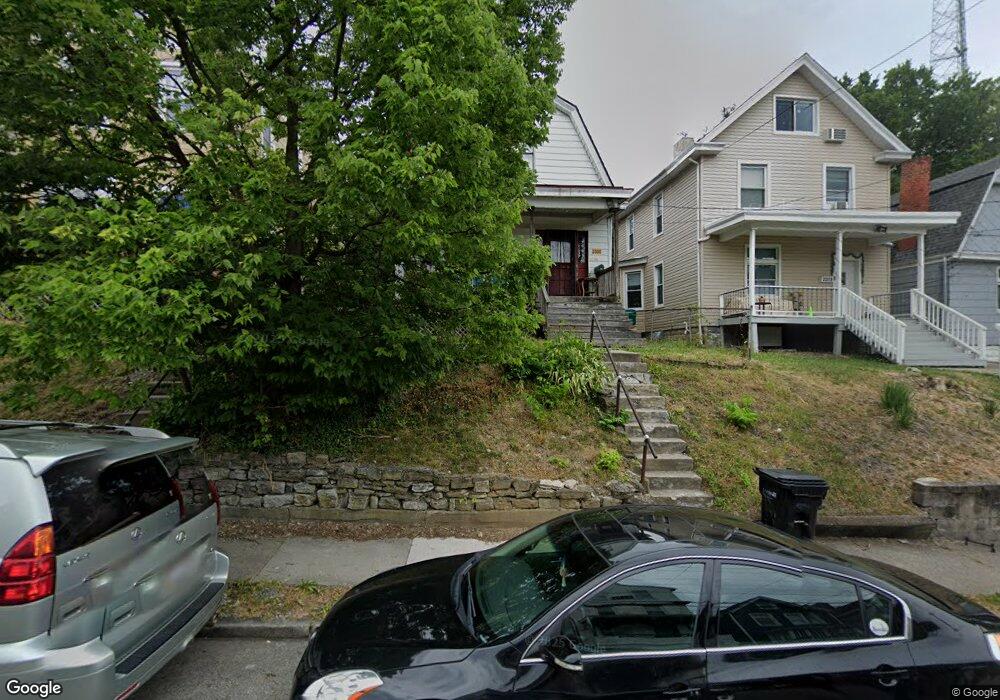
2330 Victor St Cincinnati, OH 45219
Clifton NeighborhoodEstimated Value: $205,852 - $270,000
2
Beds
2
Baths
1,394
Sq Ft
$180/Sq Ft
Est. Value
About This Home
This home is located at 2330 Victor St, Cincinnati, OH 45219 and is currently estimated at $251,213, approximately $180 per square foot. 2330 Victor St is a home located in Hamilton County with nearby schools including Clifton Area Neighborhood School, Robert A. Taft Information Technology High School, and Gilbert A. Dater High School.
Ownership History
Date
Name
Owned For
Owner Type
Purchase Details
Closed on
Dec 23, 2002
Sold by
Novak Steven J and Novak James G
Bought by
Cheevers Craig and Cheevers Christine
Current Estimated Value
Home Financials for this Owner
Home Financials are based on the most recent Mortgage that was taken out on this home.
Original Mortgage
$70,380
Interest Rate
6.13%
Purchase Details
Closed on
Apr 2, 1997
Sold by
Schroeder Janice M
Bought by
Novak Steven J and Schour James G
Home Financials for this Owner
Home Financials are based on the most recent Mortgage that was taken out on this home.
Original Mortgage
$42,400
Interest Rate
7.74%
Purchase Details
Closed on
Apr 14, 1995
Sold by
Dumford Harold R and Dumford Sally L
Bought by
Schroeder Janice M
Home Financials for this Owner
Home Financials are based on the most recent Mortgage that was taken out on this home.
Original Mortgage
$42,000
Interest Rate
8.64%
Create a Home Valuation Report for This Property
The Home Valuation Report is an in-depth analysis detailing your home's value as well as a comparison with similar homes in the area
Home Values in the Area
Average Home Value in this Area
Purchase History
| Date | Buyer | Sale Price | Title Company |
|---|---|---|---|
| Cheevers Craig | $78,200 | Advanced Land Title Agency L | |
| Novak Steven J | $53,000 | -- | |
| Schroeder Janice M | -- | -- |
Source: Public Records
Mortgage History
| Date | Status | Borrower | Loan Amount |
|---|---|---|---|
| Closed | Cheevers Craig | $70,380 | |
| Previous Owner | Novak Steven J | $42,400 | |
| Previous Owner | Schroeder Janice M | $42,000 |
Source: Public Records
Tax History Compared to Growth
Tax History
| Year | Tax Paid | Tax Assessment Tax Assessment Total Assessment is a certain percentage of the fair market value that is determined by local assessors to be the total taxable value of land and additions on the property. | Land | Improvement |
|---|---|---|---|---|
| 2024 | $3,031 | $47,814 | $15,610 | $32,204 |
| 2023 | $3,037 | $47,814 | $15,610 | $32,204 |
| 2022 | $2,216 | $31,350 | $5,933 | $25,417 |
| 2021 | $2,177 | $31,350 | $5,933 | $25,417 |
| 2020 | $2,183 | $31,350 | $5,933 | $25,417 |
| 2019 | $2,104 | $27,500 | $5,205 | $22,295 |
| 2018 | $2,105 | $27,500 | $5,205 | $22,295 |
| 2017 | $2,027 | $27,500 | $5,205 | $22,295 |
| 2016 | $1,962 | $25,960 | $5,009 | $20,951 |
| 2015 | $1,754 | $25,960 | $5,009 | $20,951 |
| 2014 | $1,764 | $25,960 | $5,009 | $20,951 |
| 2013 | $1,617 | $23,388 | $4,512 | $18,876 |
Source: Public Records
Map
Nearby Homes
- 2326 Stratford Ave
- 2311 Stratford Ave
- 2308 Stratford Ave
- 2323 Flora St
- 343 Ada St
- 305 Warner St
- 2335 Rohs St
- 348 Volkert Ave
- 255 Warner St
- 2344 Rohs St
- 404 Warner St
- 2464 Fairview Ave
- 2462 Fairview Ave
- 276 Emming St
- 2404 W Clifton Ave
- 2402 W Clifton Ave
- 426 Southview Ave
- 231 Atkinson St
- 2317 Muriel Ct
- 447 Warner St
- 2326 Victor St
- 2334 Victor St
- 2336 Victor St Unit 2
- 2336 Victor St Unit 1
- 2322 Victor St
- 2340 Victor St
- 2333 Stratford Ave
- 2331 Stratford Ave
- 2320 Victor St
- 2329 Stratford Ave
- 2342 Victor St
- 2337 Stratford Ave
- 2327 Stratford Ave
- 2339 Stratford Ave
- 2318 Victor St
- 2325 Stratford Ave
- 2325 Stratford Ave
- 2325 Stratford Ave Unit 1
- 2344 Victor St
- 2335 Victor St