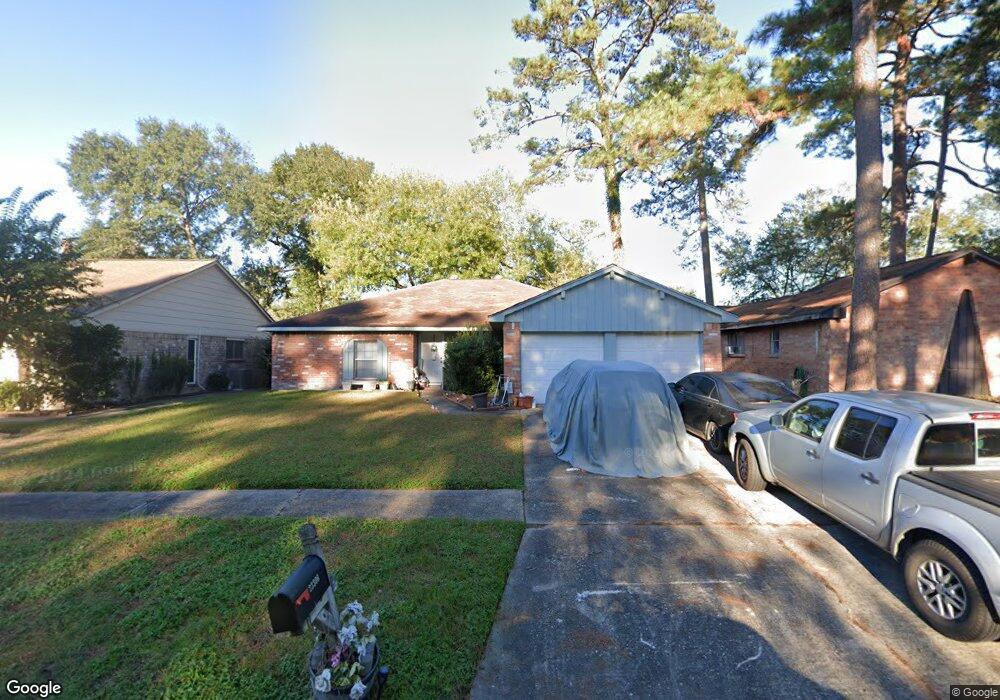
23306 Tree Bright Ln Spring, TX 77373
Estimated Value: $221,460 - $247,000
4
Beds
2
Baths
1,822
Sq Ft
$128/Sq Ft
Est. Value
About This Home
This home is located at 23306 Tree Bright Ln, Spring, TX 77373 and is currently estimated at $233,865, approximately $128 per square foot. 23306 Tree Bright Ln is a home located in Harris County with nearby schools including Chet Burchett Elementary School, Dueitt Middle School, and Spring High School.
Ownership History
Date
Name
Owned For
Owner Type
Purchase Details
Closed on
Jan 9, 2006
Sold by
Wells Fargo Bank Na
Bought by
Conway Deanne
Current Estimated Value
Home Financials for this Owner
Home Financials are based on the most recent Mortgage that was taken out on this home.
Original Mortgage
$93,000
Outstanding Balance
$52,118
Interest Rate
6.22%
Mortgage Type
Fannie Mae Freddie Mac
Estimated Equity
$181,747
Purchase Details
Closed on
Dec 2, 2003
Sold by
Murillo Arturo and Murillo Dennis Cecelia
Bought by
Federal Home Loan Mortgage Corporation
Purchase Details
Closed on
Jun 27, 2000
Sold by
M J Holdings Inc
Bought by
Murillo Arturo and Dennis Cecelia
Home Financials for this Owner
Home Financials are based on the most recent Mortgage that was taken out on this home.
Original Mortgage
$93,100
Interest Rate
8.36%
Create a Home Valuation Report for This Property
The Home Valuation Report is an in-depth analysis detailing your home's value as well as a comparison with similar homes in the area
Home Values in the Area
Average Home Value in this Area
Purchase History
| Date | Buyer | Sale Price | Title Company |
|---|---|---|---|
| Conway Deanne | -- | First American Title | |
| Federal Home Loan Mortgage Corporation | $79,005 | -- | |
| Murillo Arturo | -- | First American Heritage Titl |
Source: Public Records
Mortgage History
| Date | Status | Borrower | Loan Amount |
|---|---|---|---|
| Open | Conway Deanne | $93,000 | |
| Previous Owner | Murillo Arturo | $93,100 |
Source: Public Records
Tax History
| Year | Tax Paid | Tax Assessment Tax Assessment Total Assessment is a certain percentage of the fair market value that is determined by local assessors to be the total taxable value of land and additions on the property. | Land | Improvement |
|---|---|---|---|---|
| 2025 | $2,490 | $228,514 | $52,841 | $175,673 |
| 2024 | $2,490 | $218,983 | $52,841 | $166,142 |
| 2023 | $2,490 | $219,836 | $52,841 | $166,995 |
| 2022 | $3,330 | $194,483 | $37,117 | $157,366 |
| 2021 | $3,183 | $153,624 | $15,466 | $138,158 |
| 2020 | $2,997 | $142,806 | $15,466 | $127,340 |
| 2019 | $2,802 | $141,362 | $14,378 | $126,984 |
| 2018 | $2,037 | $118,132 | $14,378 | $103,754 |
| 2017 | $2,314 | $118,132 | $14,378 | $103,754 |
| 2016 | $2,104 | $118,132 | $14,378 | $103,754 |
| 2015 | $1,457 | $102,963 | $14,378 | $88,585 |
| 2014 | $1,457 | $84,332 | $14,378 | $69,954 |
Source: Public Records
Map
Nearby Homes
- 5918 Crooked Post Rd
- 23110 Pennsgrove Rd
- 6007 Knotty Post Ln
- 5407 Rushstone Ln
- 6031 Crooked Post Rd
- 23022 Laketree Ln
- 5311 Oaklynn Dr
- 5414 Sweetwind Ln
- 6126 Knotty Post Ln
- 5302 Oaklynn Dr
- 5402 Sherrylee Ln
- 5314 Sweetwind Ln
- 4910 Treaschwig Rd
- 5311 Sweetwind Ln
- 5410 Dibello Forest Ln
- 23502 Glenbuck St
- 23206 Goodfellow Dr
- 5031 Glendower Dr
- 5023 Glendower Dr
- 5031 Monteith Dr
- 23310 Tree Bright Ln
- 23302 Tree Bright Ln
- 23218 Tree Bright Ln
- 23314 Tree Bright Ln
- 23307 Good Dale Ln
- 23311 Good Dale Ln
- 23303 Good Dale Ln
- 23307 Tree Bright Ln
- 23315 Good Dale Ln
- 23311 Tree Bright Ln
- 23318 Tree Bright Ln
- 23303 Tree Bright Ln
- 23214 Tree Bright Ln
- 23219 Good Dale Ln
- 23315 Tree Bright Ln
- 23219 Tree Bright Ln
- 23319 Good Dale Ln
- 23215 Good Dale Ln
- 23210 Tree Bright Ln
- 23319 Tree Bright Ln
Your Personal Tour Guide
Ask me questions while you tour the home.