Estimated Value: $268,000 - $275,000
3
Beds
1
Bath
1,104
Sq Ft
$245/Sq Ft
Est. Value
About This Home
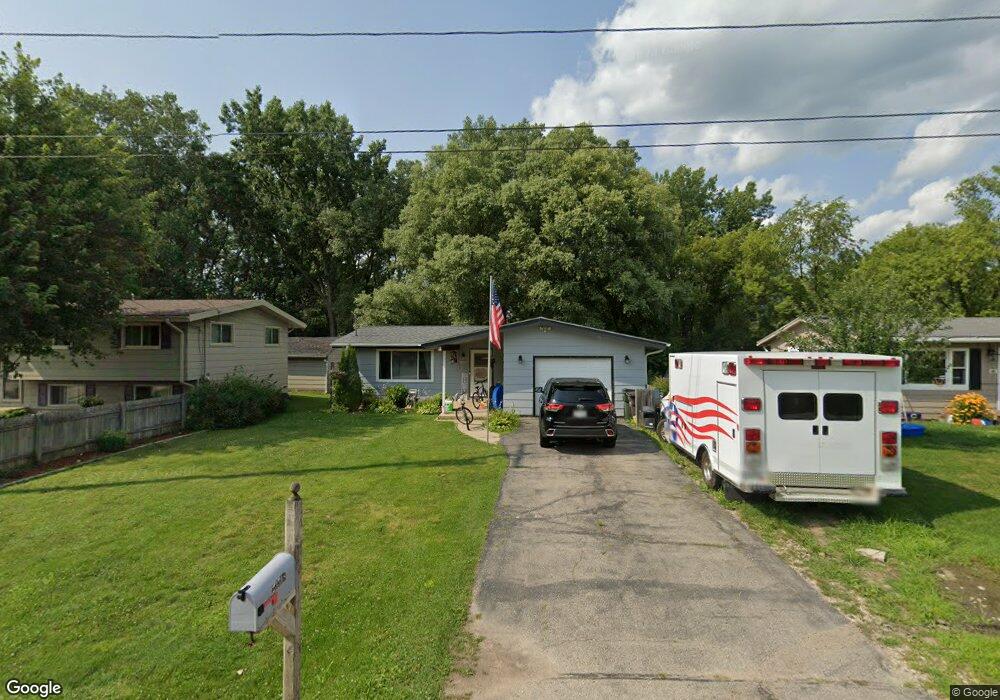
This home is located at 23308 62nd St, Salem, WI 53168 and is currently estimated at $270,949, approximately $245 per square foot. 23308 62nd St is a home located in Kenosha County with nearby schools including Salem Elementary School and Central High School.
Ownership History
Date
Name
Owned For
Owner Type
Purchase Details
Closed on
Mar 5, 2020
Sold by
R & D Invt Properties Llc
Bought by
Fleming Michelle L and Fleming Dustin M
Current Estimated Value
Home Financials for this Owner
Home Financials are based on the most recent Mortgage that was taken out on this home.
Original Mortgage
$173,794
Outstanding Balance
$156,026
Interest Rate
4.25%
Mortgage Type
FHA
Estimated Equity
$114,923
Purchase Details
Closed on
Dec 9, 2013
Sold by
Reinke Robert C
Bought by
R & D Investment Properties Llc
Create a Home Valuation Report for This Property
The Home Valuation Report is an in-depth analysis detailing your home's value as well as a comparison with similar homes in the area
Home Values in the Area
Average Home Value in this Area
Purchase History
| Date | Buyer | Sale Price | Title Company |
|---|---|---|---|
| Fleming Michelle L | $177,000 | Knight Barry Title | |
| R & D Investment Properties Llc | -- | -- | |
| Reinke Robert C | -- | -- |
Source: Public Records
Mortgage History
| Date | Status | Borrower | Loan Amount |
|---|---|---|---|
| Open | Fleming Michelle L | $173,794 | |
| Closed | Reinke Robert C | $0 |
Source: Public Records
Tax History Compared to Growth
Tax History
| Year | Tax Paid | Tax Assessment Tax Assessment Total Assessment is a certain percentage of the fair market value that is determined by local assessors to be the total taxable value of land and additions on the property. | Land | Improvement |
|---|---|---|---|---|
| 2024 | $3,174 | $229,000 | $33,500 | $195,500 |
| 2023 | $2,676 | $229,000 | $33,500 | $195,500 |
| 2022 | $3,043 | $185,500 | $30,000 | $155,500 |
| 2021 | $2,935 | $185,500 | $30,000 | $155,500 |
| 2020 | $3,095 | $150,000 | $18,500 | $131,500 |
| 2019 | $3,086 | $150,000 | $18,500 | $131,500 |
| 2018 | $3,074 | $150,000 | $18,500 | $131,500 |
| 2017 | $3,054 | $117,500 | $18,500 | $99,000 |
| 2016 | $3,072 | $117,500 | $18,500 | $99,000 |
| 2015 | $2,681 | $117,500 | $18,500 | $99,000 |
| 2014 | $3,029 | $117,500 | $18,500 | $99,000 |
Source: Public Records
Map
Nearby Homes