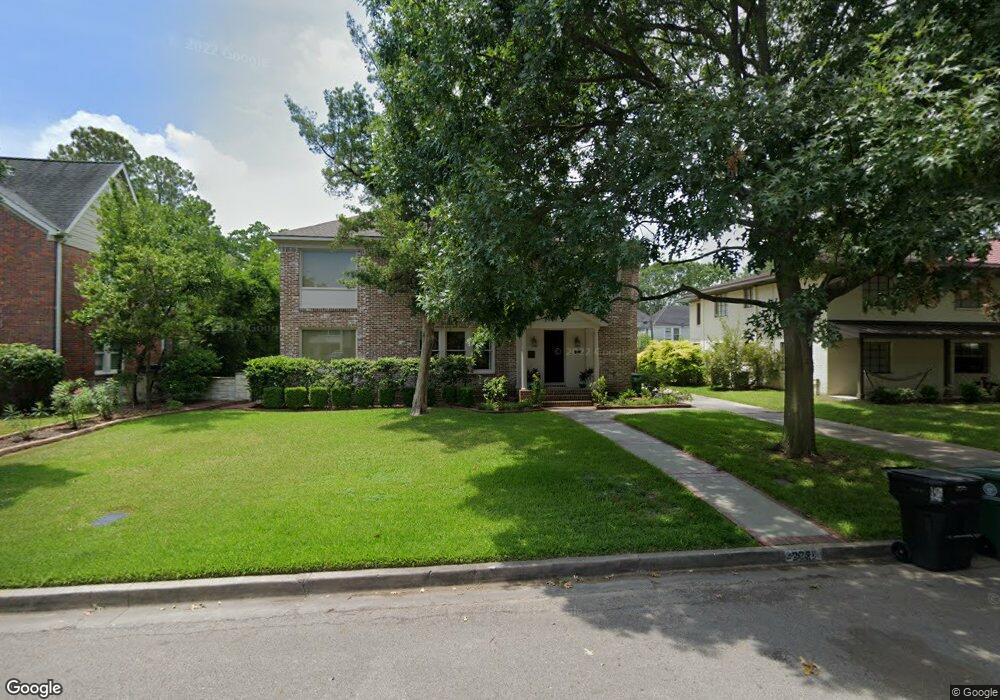
2331 Albans Rd Unit B Houston, TX 77005
University Place NeighborhoodEstimated Value: $964,000 - $1,618,575
3
Beds
2
Baths
3,800
Sq Ft
$332/Sq Ft
Est. Value
About This Home
This home is located at 2331 Albans Rd Unit B, Houston, TX 77005 and is currently estimated at $1,263,192, approximately $332 per square foot. 2331 Albans Rd Unit B is a home located in Harris County with nearby schools including Poe Elementary School, Lanier Middle School, and Lamar High School.
Ownership History
Date
Name
Owned For
Owner Type
Purchase Details
Closed on
Oct 11, 2022
Sold by
Hajdik Heather Marie
Bought by
Hajdik Brock Randall
Current Estimated Value
Purchase Details
Closed on
Oct 28, 2004
Sold by
Nash Robert
Bought by
Hajdik Brock R and Hajdik Heather Marie
Home Financials for this Owner
Home Financials are based on the most recent Mortgage that was taken out on this home.
Original Mortgage
$440,000
Interest Rate
5.73%
Mortgage Type
Purchase Money Mortgage
Purchase Details
Closed on
Mar 31, 1999
Sold by
Tanglewood Corp
Bought by
Nash Charles W
Home Financials for this Owner
Home Financials are based on the most recent Mortgage that was taken out on this home.
Original Mortgage
$234,000
Interest Rate
6.82%
Purchase Details
Closed on
Apr 2, 1998
Sold by
Miller Charles William Farrington
Bought by
Tanglewood Corp
Purchase Details
Closed on
Oct 1, 1993
Sold by
Tanglewood Corp
Bought by
Miller Charles William Farrington
Create a Home Valuation Report for This Property
The Home Valuation Report is an in-depth analysis detailing your home's value as well as a comparison with similar homes in the area
Home Values in the Area
Average Home Value in this Area
Purchase History
| Date | Buyer | Sale Price | Title Company |
|---|---|---|---|
| Hajdik Brock Randall | -- | -- | |
| Hajdik Brock Randall | -- | -- | |
| Hajdik Brock R | -- | Alamo Title | |
| Hajdik Brock R | -- | Alamo Title | |
| Nash Charles W | -- | Ticor Title Services | |
| Nash Charles W | -- | Ticor Title Services | |
| Tanglewood Corp | -- | -- | |
| Tanglewood Corp | -- | -- | |
| Miller Charles William Farrington | -- | -- | |
| Miller Charles William Farrington | -- | -- |
Source: Public Records
Mortgage History
| Date | Status | Borrower | Loan Amount |
|---|---|---|---|
| Previous Owner | Hajdik Brock R | $440,000 | |
| Previous Owner | Nash Charles W | $234,000 |
Source: Public Records
Tax History Compared to Growth
Tax History
| Year | Tax Paid | Tax Assessment Tax Assessment Total Assessment is a certain percentage of the fair market value that is determined by local assessors to be the total taxable value of land and additions on the property. | Land | Improvement |
|---|---|---|---|---|
| 2025 | $23,534 | $1,455,300 | $1,034,250 | $421,050 |
| 2024 | $23,534 | $1,455,300 | $1,034,250 | $421,050 |
| 2023 | $23,534 | $1,420,000 | $1,034,250 | $385,750 |
| 2022 | $27,347 | $1,242,000 | $997,313 | $244,687 |
| 2021 | $27,558 | $1,182,394 | $960,375 | $222,019 |
| 2020 | $26,598 | $1,098,353 | $886,500 | $211,853 |
| 2019 | $28,033 | $1,114,400 | $849,563 | $264,837 |
| 2018 | $20,187 | $1,007,116 | $738,750 | $268,366 |
| 2017 | $27,668 | $1,094,200 | $738,750 | $355,450 |
| 2016 | $26,925 | $1,070,145 | $701,813 | $368,332 |
| 2015 | $18,013 | $1,070,145 | $701,813 | $368,332 |
| 2014 | $18,013 | $976,619 | $627,938 | $348,681 |
Source: Public Records
Map
Nearby Homes
- 2350 Wroxton Rd
- 2332 Wroxton Rd
- 2405 Nottingham St
- 2438 Albans Rd
- 2433 Nottingham St
- 2231 Albans Rd
- 2432 Quenby St
- 2434 Quenby St
- 2436 Bissonnet St Unit 8
- 2248 Robinhood St
- 2247 Bartlett St
- 2520 Robinhood St Unit 1001
- 2520 Robinhood St Unit 1012
- 2520 Robinhood St Unit 1008
- 2520 Robinhood St Unit 1200
- 2320 Bartlett St
- 2216 Tangley St
- 2135 Quenby St
- 2122 Wroxton Rd
- 2129 Quenby St
- 2331 Albans Rd
- 2331 Albans Rd Unit A
- 2333 Albans Rd
- 2327 Albans Rd
- 2339 Albans Rd
- 2341 Albans Rd
- 2330 Sunset Blvd
- 2326 Sunset Blvd
- 2323 Albans Rd
- 2338 Sunset Blvd
- 2332 Albans Rd
- 2336 Albans Rd
- 2336 Albans Rd Unit 2
- 2345 Albans Rd
- 2318 Sunset Blvd
- 2347 Albans Rd
- 2340 Albans Rd
- 2330 Albans Rd
- 2342 Sunset Blvd
- 2319 Albans Rd