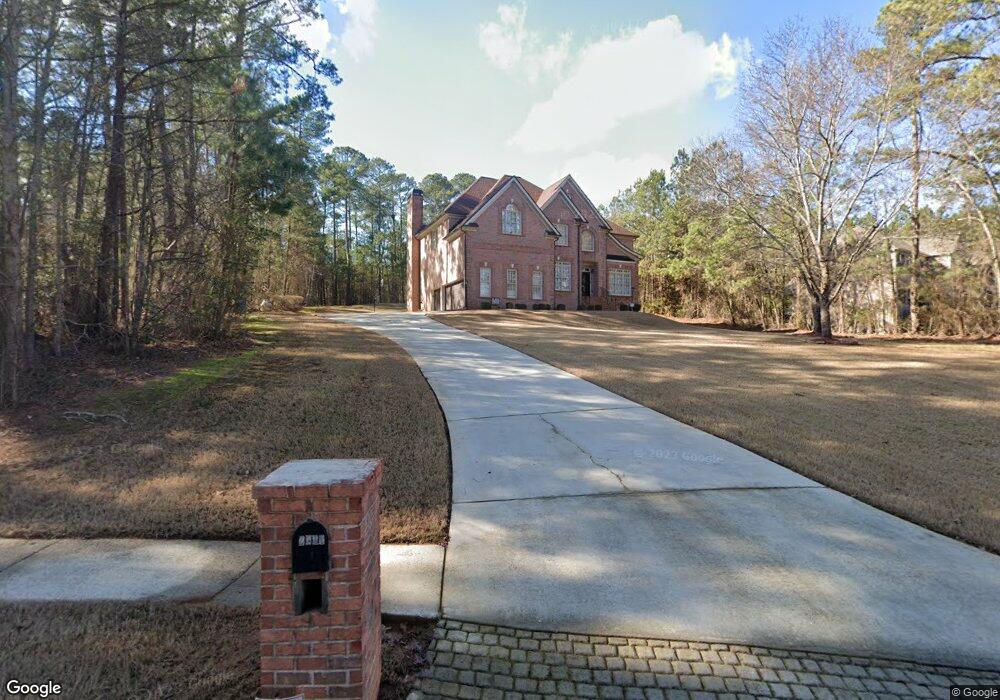
2331 Fairhaven Cove NE Unit 2 Conyers, GA 30012
Estimated Value: $491,000 - $621,000
4
Beds
5
Baths
3,705
Sq Ft
$155/Sq Ft
Est. Value
About This Home
This home is located at 2331 Fairhaven Cove NE Unit 2, Conyers, GA 30012 and is currently estimated at $573,882, approximately $154 per square foot. 2331 Fairhaven Cove NE Unit 2 is a home located in Rockdale County with nearby schools including Hightower Trail Elementary School, Conyers Middle School, and Rockdale County High School.
Ownership History
Date
Name
Owned For
Owner Type
Purchase Details
Closed on
Dec 28, 2001
Sold by
Walker Marrithia D
Bought by
Duncan Carlton M
Current Estimated Value
Home Financials for this Owner
Home Financials are based on the most recent Mortgage that was taken out on this home.
Original Mortgage
$387,000
Outstanding Balance
$170,560
Interest Rate
6.85%
Mortgage Type
New Conventional
Estimated Equity
$403,323
Purchase Details
Closed on
Nov 25, 1998
Sold by
Meechan Dennis J and Mary Ann
Bought by
Walker Marrithia D
Home Financials for this Owner
Home Financials are based on the most recent Mortgage that was taken out on this home.
Original Mortgage
$34,100
Interest Rate
6.77%
Mortgage Type
New Conventional
Create a Home Valuation Report for This Property
The Home Valuation Report is an in-depth analysis detailing your home's value as well as a comparison with similar homes in the area
Home Values in the Area
Average Home Value in this Area
Purchase History
| Date | Buyer | Sale Price | Title Company |
|---|---|---|---|
| Duncan Carlton M | $39,900 | -- | |
| Walker Marrithia D | $37,900 | -- |
Source: Public Records
Mortgage History
| Date | Status | Borrower | Loan Amount |
|---|---|---|---|
| Open | Duncan Carlton M | $387,000 | |
| Previous Owner | Walker Marrithia D | $34,100 |
Source: Public Records
Tax History Compared to Growth
Tax History
| Year | Tax Paid | Tax Assessment Tax Assessment Total Assessment is a certain percentage of the fair market value that is determined by local assessors to be the total taxable value of land and additions on the property. | Land | Improvement |
|---|---|---|---|---|
| 2024 | $6,350 | $279,440 | $53,600 | $225,840 |
| 2023 | $4,742 | $227,480 | $38,960 | $188,520 |
| 2022 | $4,224 | $190,600 | $33,840 | $156,760 |
| 2021 | $3,820 | $148,360 | $29,320 | $119,040 |
| 2020 | $3,439 | $128,880 | $24,000 | $104,880 |
| 2019 | $3,645 | $132,800 | $18,000 | $114,800 |
| 2018 | $3,669 | $132,800 | $18,000 | $114,800 |
| 2017 | $3,383 | $122,120 | $18,000 | $104,120 |
| 2016 | $3,123 | $122,120 | $18,000 | $104,120 |
| 2015 | $3,392 | $131,160 | $18,000 | $113,160 |
| 2014 | $3,025 | $131,160 | $18,000 | $113,160 |
| 2013 | -- | $129,240 | $20,000 | $109,240 |
Source: Public Records
Map
Nearby Homes
- 3070 N Tower Way NE
- 3150 Haverhill Cove NE Unit 2
- 0 E Hightower Trail
- 3295 Highway 138 NE
- 3449 Highway 138 NE
- 00 E Hightower Trail
- 0 Salem Church Rd NE Unit 10167606
- 2827 Highway 138 NE
- 0 Stream View Dr Unit LOT 19
- 2528 Stream View Dr
- 2040 Costley Mill Rd NE
- 2141 Arlin St NE
- 2331 Leafway Trail NE
- 2316 Hi Roc Cir NE
- 2635 Twin Oaks Dr NE
- 2643 Twin Oaks Dr NE
- 3058 White Rd NE
- 3250 Miller Bottom Rd
- 0 Hi Roc Rd NE Unit 20126550
- 2208 Clarendon Ct NE
- 2341 Fairhaven Cove NE Unit 2
- 2321 Fairhaven Cove NE
- 2351 Fairhaven Cove NE Unit 2
- 2311 Fairhaven Cove NE
- 3000 Nantucket Cove NE Unit 2
- 2361 Fairhaven Cove NE
- 2310 Fairhaven Cove NE
- 3001 Nantucket Cove NE Unit 2
- 3010 Nantucket Cove NE
- 3020 NE North Tower Way
- 2371 Fairhaven Cove NE
- 3020 N Tower Way NE
- 0 Fairhaven Cove NE Unit 3126381
- 0 Fairhaven Cove NE Unit 8715075
- 0 Fairhaven Cove NE Unit 8677601
- 0 Fairhaven Cove NE Unit 8652927
- 0 Fairhaven Cove NE Unit 8618684
- 0 Fairhaven Cove NE Unit 8655450
- 0 Fairhaven Cove NE Unit 7479886
- 0 Fairhaven Cove NE Unit 7218472