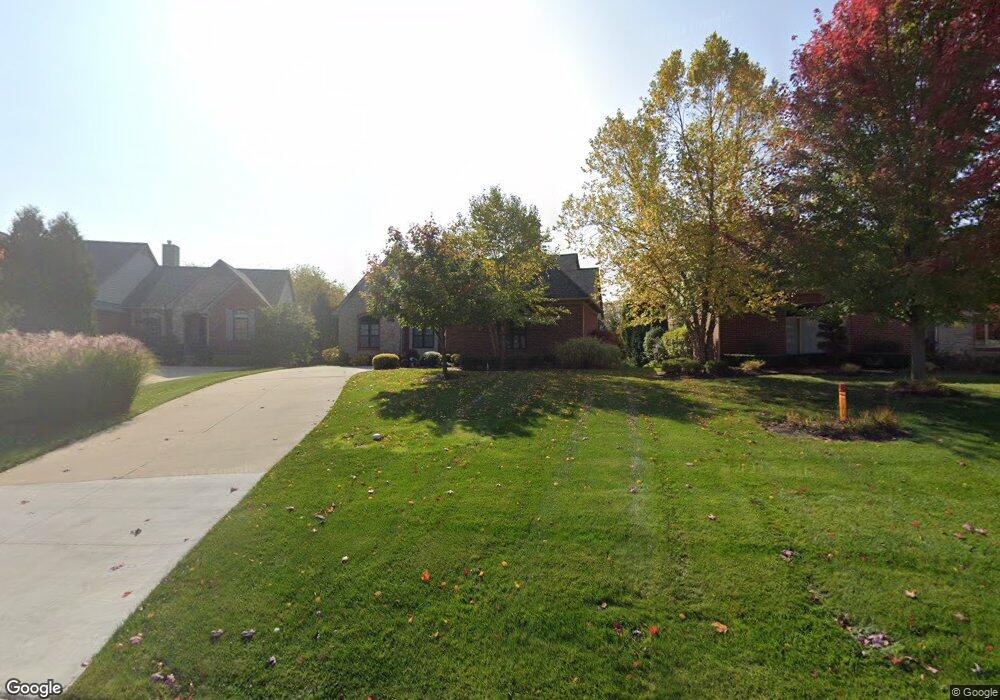
2331 Quaker Ridge Dr Unit 53 Ann Arbor, MI 48108
Stonebridge NeighborhoodEstimated Value: $780,000 - $794,000
3
Beds
3
Baths
2,246
Sq Ft
$352/Sq Ft
Est. Value
About This Home
This home is located at 2331 Quaker Ridge Dr Unit 53, Ann Arbor, MI 48108 and is currently estimated at $789,667, approximately $351 per square foot. 2331 Quaker Ridge Dr Unit 53 is a home located in Washtenaw County with nearby schools including Heritage School, Harvest Elementary School, and Saline Middle School.
Ownership History
Date
Name
Owned For
Owner Type
Purchase Details
Closed on
Sep 16, 2019
Sold by
Crowley Dennis C
Bought by
Crowley Dennis C and Clos Anita M
Current Estimated Value
Purchase Details
Closed on
Feb 22, 2013
Sold by
Trowbridge Homes Of Stonebridge Llc
Bought by
Dennis C Crowley & Donna M Crowley Trust
Purchase Details
Closed on
Jun 10, 2011
Sold by
Hrp Jrh Llc
Bought by
Trowbridge Homes Of Stonebridge Llc
Purchase Details
Closed on
Feb 15, 2007
Sold by
Signature Communities Land Holdings Llc
Bought by
Hrp Jrh Llc
Purchase Details
Closed on
Jan 18, 2007
Sold by
Signature Communities Land Holdings Llc
Bought by
Hrp Jrp Llc
Purchase Details
Closed on
Aug 29, 2006
Sold by
Stock Building Supply Llc
Bought by
Signature Communities Llc
Purchase Details
Closed on
Sep 29, 2005
Sold by
John Richards Homes Signature Series Llc
Bought by
Stock Building Supply Llc
Create a Home Valuation Report for This Property
The Home Valuation Report is an in-depth analysis detailing your home's value as well as a comparison with similar homes in the area
Home Values in the Area
Average Home Value in this Area
Purchase History
| Date | Buyer | Sale Price | Title Company |
|---|---|---|---|
| Crowley Dennis C | -- | None Available | |
| Crowley Dennis C | -- | None Available | |
| Dennis C Crowley & Donna M Crowley Trust | $40,000 | None Available | |
| Trowbridge Homes Of Stonebridge Llc | $38,000 | None Available | |
| Trowbridge Homes Of Stonebridge Llc | -- | None Available | |
| Hrp Jrh Llc | -- | None Available | |
| Hrp Jrp Llc | $5,900,000 | None Available | |
| Signature Communities Llc | -- | None Available | |
| Stock Building Supply Llc | $85,880 | -- |
Source: Public Records
Tax History Compared to Growth
Tax History
| Year | Tax Paid | Tax Assessment Tax Assessment Total Assessment is a certain percentage of the fair market value that is determined by local assessors to be the total taxable value of land and additions on the property. | Land | Improvement |
|---|---|---|---|---|
| 2025 | $8,832 | $378,544 | $0 | $0 |
| 2024 | $8,582 | $370,261 | $0 | $0 |
| 2023 | $8,188 | $334,600 | $0 | $0 |
| 2022 | $11,140 | $308,200 | $0 | $0 |
| 2021 | $10,818 | $299,700 | $0 | $0 |
| 2020 | $10,378 | $276,700 | $0 | $0 |
| 2019 | $10,109 | $268,500 | $268,500 | $0 |
| 2018 | $9,899 | $272,200 | $0 | $0 |
| 2017 | $9,516 | $271,100 | $0 | $0 |
| 2016 | $7,095 | $248,647 | $0 | $0 |
| 2015 | -- | $247,904 | $0 | $0 |
| 2014 | -- | $35,000 | $0 | $0 |
| 2013 | -- | $35,000 | $0 | $0 |
Source: Public Records
Map
Nearby Homes
- 2313 Quaker Ridge Dr Unit 56
- 5401 Pinnacle Ct Unit 32
- 2477 Winged Foot Ct Unit 10
- 5449 Countryside Dr
- 5117 Doral Ct Unit 2
- 4955 Quincy Ct Unit 9
- 4703 4703 Sawgrass Drive West Dr W
- 2641 Aspen Rd
- 5656 Pebble Ridge Ct
- 1055 Overlook Ct
- 1053 Overlook Ct
- 1057 Overlook Ct
- 1487 Saint James Blvd
- 1989 Stonebridge Dr N
- 2736 Aspen Ct Unit 9
- 5179 Wimbledon Cir
- 606 Gretchen Ln
- 751 Haywood Dr
- 888 Risdon Trail S
- 850 Kuss Dr
- 2337 Quaker Ridge Dr Unit 52
- 2325 Quaker Ridge Dr Unit 54
- 2343 Quaker Ridge Dr
- 2319 Quaker Ridge Dr Unit 55
- 0 Quaker Ridge Dr
- 2328 Quaker Ridge Dr
- 2349 Quaker Ridge Dr
- 2349 Quaker Ridge
- 2340 Quaker Ridge Dr
- 2346 Quaker Ridge Dr
- 2346 Quaker Ridge Dr Unit 59
- 2355 Quaker Ridge Dr Unit 49
- 2307 Quaker Ridge Dr
- 2352 Quaker Ridge Dr Unit 58
- 5426 Pinnacle Ct Unit 62
- 5418 Pinnacle Ct Unit 63
- 2361 Quaker Ridge Dr
- 5412 Pinnacle Ct
- 5442 Pinnacle Ct
- 2367 Quaker Ridge