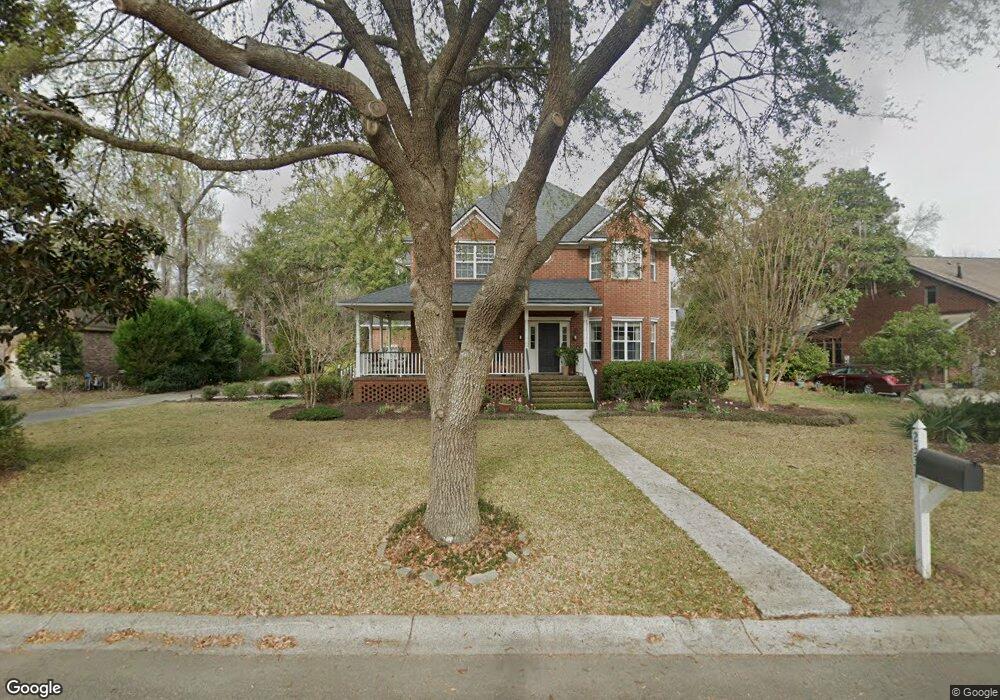
2331 Stevenson Dr Charleston, SC 29414
West Ashley NeighborhoodEstimated Value: $586,362 - $802,000
3
Beds
3
Baths
2,368
Sq Ft
$290/Sq Ft
Est. Value
About This Home
This home is located at 2331 Stevenson Dr, Charleston, SC 29414 and is currently estimated at $685,841, approximately $289 per square foot. 2331 Stevenson Dr is a home located in Charleston County with nearby schools including Drayton Hall Elementary School, West Ashley High School, and Charleston Christian School.
Ownership History
Date
Name
Owned For
Owner Type
Purchase Details
Closed on
May 4, 2009
Sold by
Antonius Robert F and Antonius Christine F
Bought by
Ware Patricia B
Current Estimated Value
Home Financials for this Owner
Home Financials are based on the most recent Mortgage that was taken out on this home.
Original Mortgage
$160,000
Outstanding Balance
$101,959
Interest Rate
5.01%
Mortgage Type
Purchase Money Mortgage
Estimated Equity
$583,882
Purchase Details
Closed on
Aug 18, 2005
Sold by
Hutsell Kevin L
Bought by
Antonius Robert F and Antonius Christine F
Purchase Details
Closed on
Apr 30, 2003
Sold by
Bolig Christopher J and Bolig Yuriko
Bought by
Hutsell Kevin L
Purchase Details
Closed on
Oct 3, 2002
Sold by
Cassady Richard L and Cassady Kristen L
Bought by
Bolig Christopher J and Bolig Yuriko
Purchase Details
Closed on
Sep 27, 2002
Sold by
Carson Milton A
Bought by
Llp Mtg Ltd
Purchase Details
Closed on
Dec 23, 1999
Sold by
Hart Robert S and Hart Karen E
Bought by
Cassady Ii Richard L and Cassady Kristen L
Create a Home Valuation Report for This Property
The Home Valuation Report is an in-depth analysis detailing your home's value as well as a comparison with similar homes in the area
Home Values in the Area
Average Home Value in this Area
Purchase History
| Date | Buyer | Sale Price | Title Company |
|---|---|---|---|
| Ware Patricia B | $300,000 | -- | |
| Antonius Robert F | $339,000 | -- | |
| Hutsell Kevin L | $270,000 | -- | |
| Bolig Christopher J | $257,000 | -- | |
| Llp Mtg Ltd | $122,800 | -- | |
| Cassady Ii Richard L | $253,500 | -- |
Source: Public Records
Mortgage History
| Date | Status | Borrower | Loan Amount |
|---|---|---|---|
| Open | Ware Patricia B | $160,000 |
Source: Public Records
Tax History Compared to Growth
Tax History
| Year | Tax Paid | Tax Assessment Tax Assessment Total Assessment is a certain percentage of the fair market value that is determined by local assessors to be the total taxable value of land and additions on the property. | Land | Improvement |
|---|---|---|---|---|
| 2024 | $1,408 | $10,200 | $0 | $0 |
| 2023 | $1,408 | $10,200 | $0 | $0 |
| 2022 | $1,294 | $10,200 | $0 | $0 |
| 2021 | $1,355 | $10,200 | $0 | $0 |
| 2020 | $1,403 | $10,200 | $0 | $0 |
| 2019 | $1,333 | $9,480 | $0 | $0 |
| 2017 | $1,288 | $11,480 | $0 | $0 |
| 2016 | $1,236 | $11,480 | $0 | $0 |
| 2015 | $1,276 | $11,480 | $0 | $0 |
| 2014 | $1,248 | $0 | $0 | $0 |
| 2011 | -- | $0 | $0 | $0 |
Source: Public Records
Map
Nearby Homes
- 3176 Hagerty Dr
- 3168 Stanyarne Dr
- 103 Toura Ln
- 2426 Lilytree Dr
- 2314 Grandiflora Blvd
- 3129 Mulan Ln
- 359 Muirfield Pkwy
- 183 Briarwood Dr
- 253 Muirfield Pkwy
- 236 Hoylake Ct
- 189 Droos Way
- 3315 Derbyshire Ct
- 3438 Farmers Market Dr
- 3005 MacBeth Creek Dr
- 3312 Hearthside Dr
- 99 Fieldfare Way
- 5008 Northfield Ct
- 3290 Middleburry Ln
- 414 Rhett Butler Dr
- 635 Fair Spring Dr
- 2337 Stevenson Dr
- 3188 Hagerty Dr
- 2338 MacLaura Hall Ave
- 2343 Stevenson Dr
- 2332 MacLaura Hall Ave
- 3194 Hagerty Dr
- 3182 Hagerty Dr
- 2332 Stevenson Dr
- 2338 Stevenson Dr
- 2344 Stevenson Dr
- 3187 Hagerty Dr
- 3191 Hagerty Dr
- 0 MacLaura Hall Ave
- 2359 Stevenson Dr
- 3181 Hagerty Dr
- 2354 MacLaura Hall Ave
- 2350 Stevenson Dr
- 2314 MacLaura Hall Ave
- 0 Hagerty Dr
- 2327 MacLaura Hall Ave